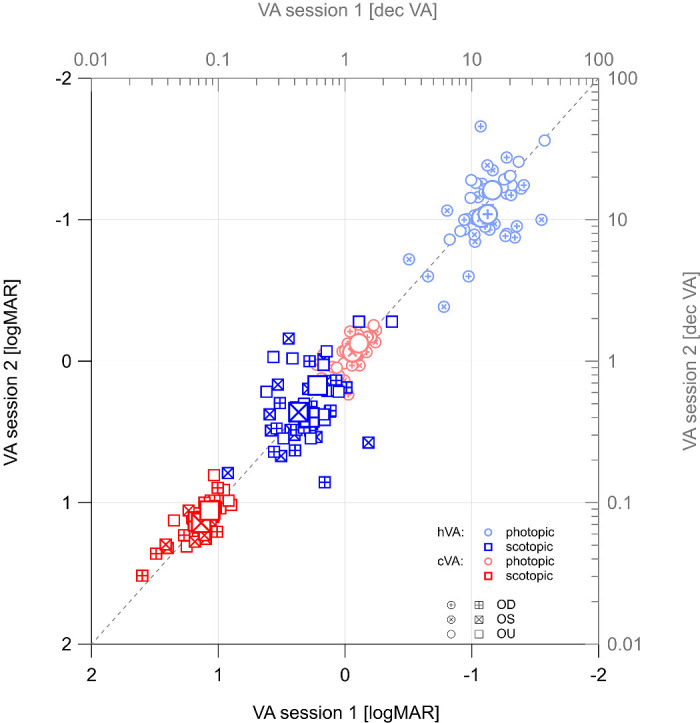
Figure 1.

Acuity comparison between sessions. For each of the four visual acuity conditions (scotopic versus photopic), individual cVA and hVA values (small symbols) for OD, OS, and OU, are shown along with group averages (large symbols; n = 16; SEMs are smaller than symbol size). No significant effects on visual acuity were observed across sessions. Note the inverted axes for logMAR values (this measure describes visual loss), such that poor visual acuity is in the bottom left quadrant and good visual acuity is in the top right quadrant; the identity line is dashed.
