


Figure 3.
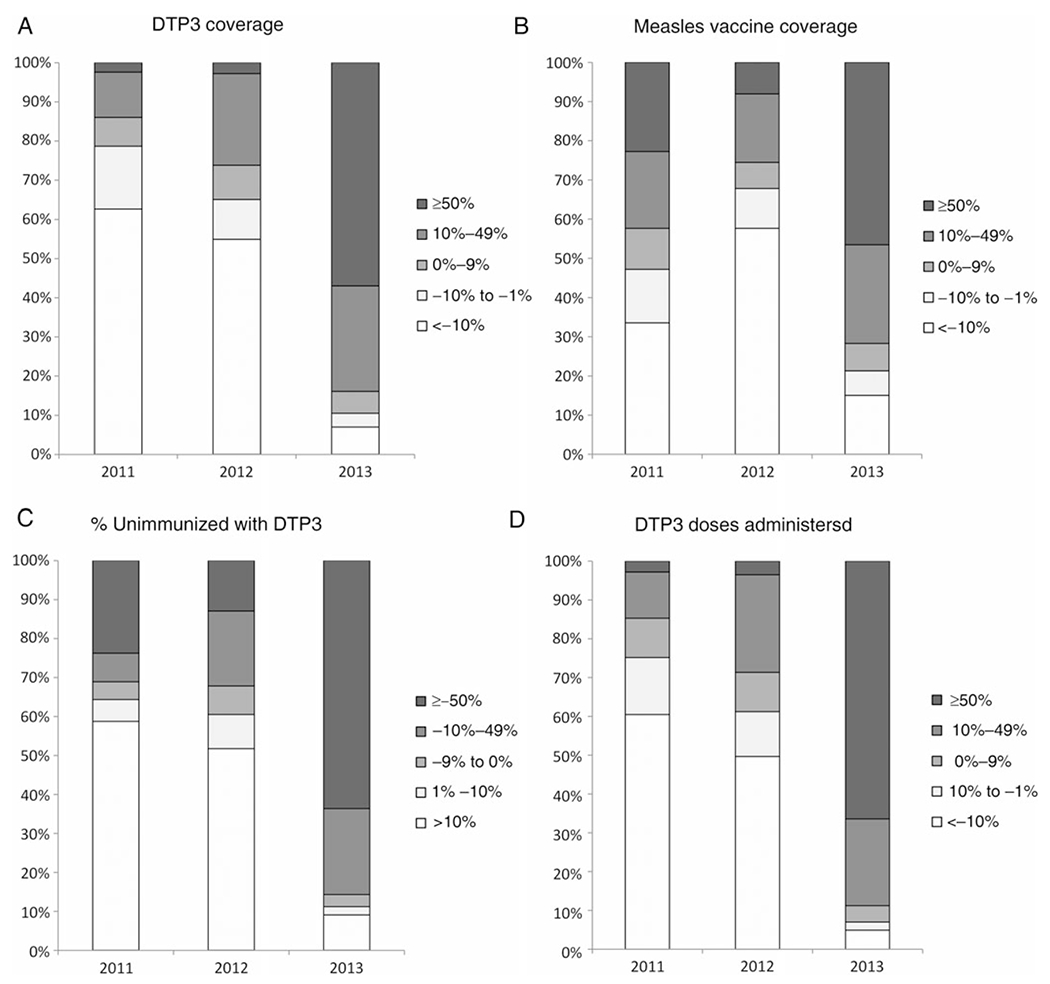
Distribution of local government areas (LGAs) by relative annual change in coverage with the third dose of diphtheria-tetanus-pertussis (DTP3) vaccine (A), coverage with measles vaccine (B), percentage of the target population unimmunized with DTP3 (C), and DTP3 doses administered (D), calculated using administrative data collected in 12 Nigerian states at high risk for polio, 2010–2013. N = 286 LGAs represented.