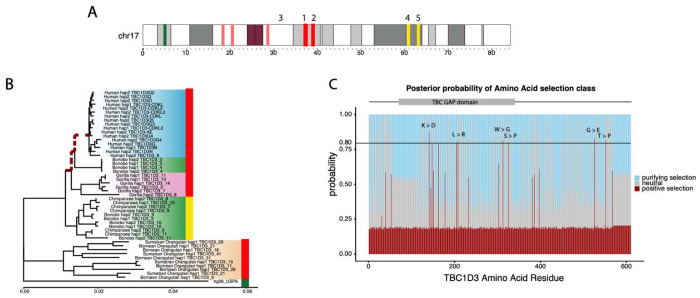
Figure 5: Positive selection of the TBC1D3 gene family.
(A) Chromosome 17 ideogram marking TBC1D3 expansion clusters and distal loci expressed in chimpanzee and bonobo. (B) Branch model test of selection for expressed TBC1D3 paralogs. Neutral, maximum likelihood phylogeny corresponding to the introns of expressed TBC1D3 paralogs used as a baseline to compute branch model test of selection in coding sequence. Red dashed branches represent branches identified under positive selection (p-value = 0.024). Colored bars on right of phylogeny illustrate location of origin of TBC1D3 copies in (A), red indicating paralogs from clusters 1 and 2, yellow marking expressed paralogs from distal q-arm expansions 3 and 4, and green marking USP6, the outgroup. (C) Branch site model test across TBC1D3. A branch site model was conducted using the codon alignment of the same TBC1D3 expressed isoforms, with the three ancestral branches leading to gorilla, chimpanzee, bonobo, and human TBC1D3 copies as the foreground, and all other branches as the background. Posterior probabilities for positive, neutral, and purifying selection are illustrated in red, gray, and blue, respectively, with red indicating sites under selection in the foreground branches (omega = 35).

