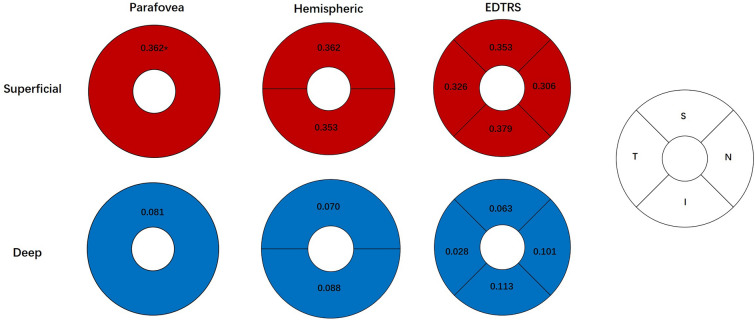
Fig. 2.
Correlation among WEM, SCP-VD and DCP-VD in different groups of patients with TAO. The red region represents a significant correlation between VD and WEM, while the blue area represents no considerable correlation between VD and WEM. *The numbers in the figure represent the correlation coefficients of WEM and VD in this region. WEM whole eye movement, SCP-VD superficial capillary plexus vessel density, DCP-VD deep capillary plexus vessel density, TAO thyroid-associated ophthalmopathy, VD retinal vessel density, S superior, T temporal, N nasal, I inferior, EDTRS Early Treatment Diabetic Retinopathy Study, TSNI temporal-superior-nasal-inferior

