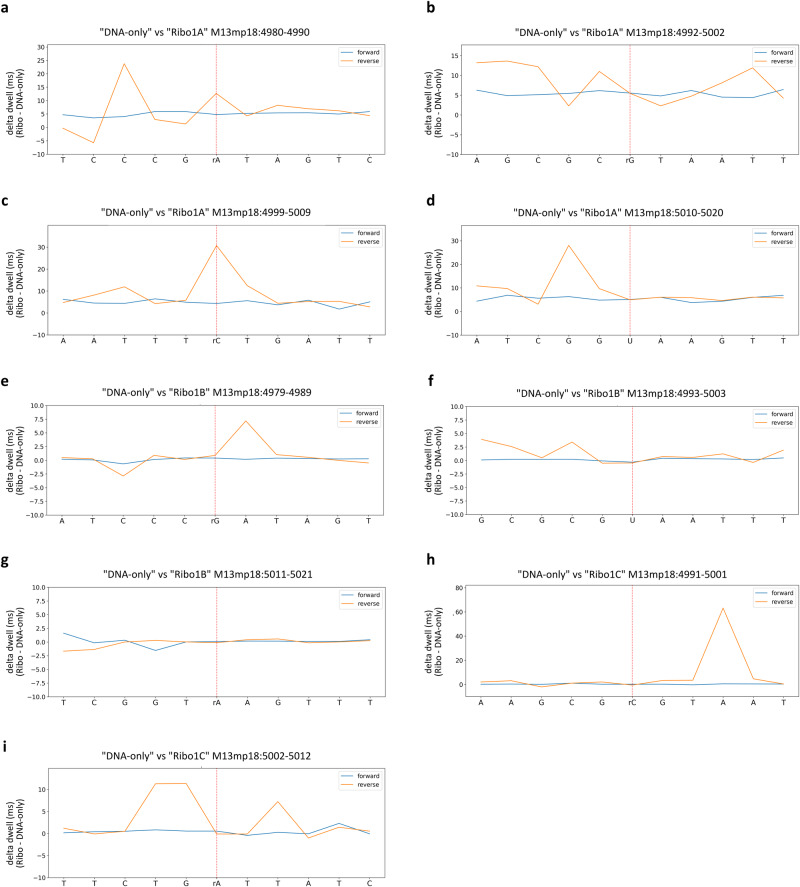
Fig. 4. Detection of rNMPs at known positions by dwell time profiles analysis.
Dwell times were extracted using the f5c eventalign software. Each panel shows the delta in the mean dwell time values retrieved from the two experimental conditions (“Ribo”–“DNA only”) and separately calculated at each position of the forward (blue) and reverse (orange) strands. Each panel represents a subset of 11 positions on the forward (upper graphs) and reverse (bottom graphs) strands, centred on each genomic coordinate where single rNMPs were expected on the reverse strand: rA at position 4985 (a), rG at position 4997 (b), rC at position 5004 (c), and U at position 5015 (d) in “Ribo1A”; rG at position 4984 (e), U at position 4998 (f), and rA at position 5016 (g) in “Ribo1B”; rC at position 4996 (h) and rA at position 5007 (i) in “Ribo1C”. Dwell times are depicted in a 5′ to 3′ direction on the forward strand, so the complementary sequence is indicated for the reverse plots.

