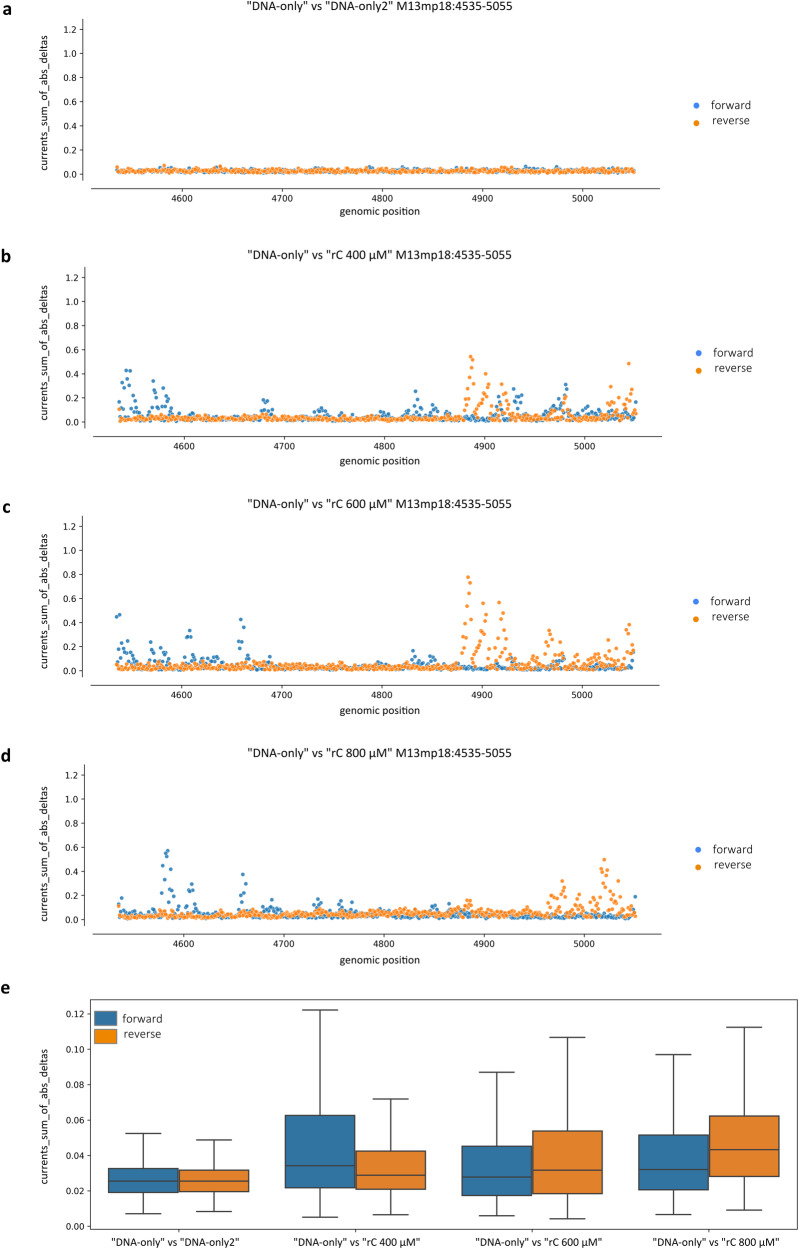
Fig. 7. Randomly incorporated rCMPs induce alterations in current intensity profiles.
a–d Ionic current values were retrieved via the f5c eventalign software. Current variations were evaluated in parallel for forward (blue) and reverse (orange) strands and computed at each M13mp18 genomic position across the 525 bp fragments containing randomly incorporated rCMPs as the sum of the absolute values of the differences between the current distributions of each “rC” sample respect to the “DNA-only” internal control. a Comparison between the two DNA-only replicates. b–d Comparison between “DNA-only” and b “rC 400 μM”, c “rC 600 μM” and d “rC 800 μM”. e The same data distributions were summarised as a box plot grouped for comparison and strand. Statistical analyses were performed by two-way ANOVA (N = 517 genomic positions, comparison: F = 52.08, df = 3, P = 4.92e−33; strand: F = 6.08, df = 1, P = 1.37e−02; comparison/strand interaction: F = 7.73, df = 3, P = 3.77e−05). The box plot shows the median as a solid black line, the first and third quartiles captured by the boundaries of the box, and whiskers defined as the first and third quartiles ± interquartile range 1.5 times.

