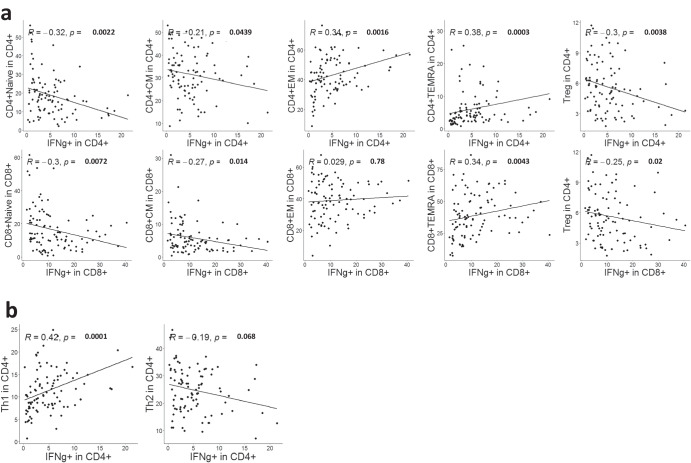
Fig. 6. IFNγ production correlates with T cell subsets identified by manual gating.
PBMCs from BC patients (n = 95) were stimulated by CD3/CD28 beads. IFNγ production was determined by flow cytometry. a Correlation of IFNγ production by CD4 (upper) and CD8 (lower) T cells with differentiation subsets of T cells (Naive, CM, EM, and TEMRA) and Tregs. b Correlation of IFNγ production by CD4 (upper) and CD8 (lower) T cells with Th subsets identified by CyTOF. Spearman rank correlation. FDR-adjusted p-values are shown.

