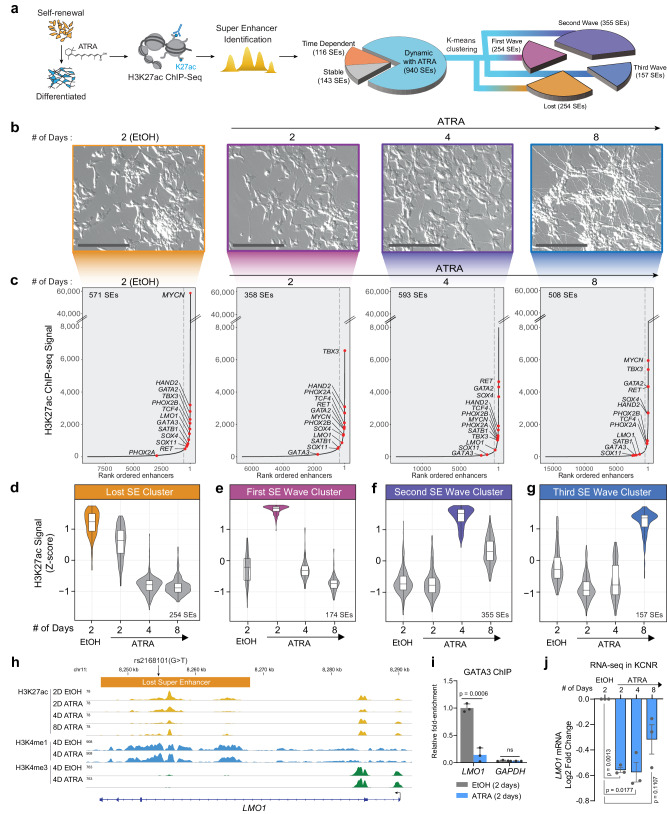
Fig. 1. ATRA treatment of NB cells reveals a dynamic change in the super-enhancer (SE) landscape.
a Schematic representation of the study design and step-by-step approach to identify SEs and downstream clusters after ATRA treatment. SEs were divided into subgroups: Stable with ATRA: SD <30% over 2, 4, and 8 days of ATRA treatment; Time Dependent: - Max variance <200 H3K27Ac signal in control (EtOH) and ATRA conditions. The remaining SEs were defined as Dynamic with ATRA and subjected to K-means clustering to identify temporal pattern. Four clusters of SEs were identified. b Images of NB cells showing the time-dependent effect of 5 µM ATRA treatment on cell morphology, representative of biological triplicate experiments. Scale bars are 200 µM. c H3K27ac binding at super-enhancers ranked by increasing signal. SEs were identified beyond the inflection point of increasing H3K27ac load (indicated by a gray dashed line). Select SE target genes are highlighted. The SEs were linked to putative target genes by proximity to expressed genes. d–g Violin plot showing the four clusters of SEs identified by z-score normalized H3K27ac signal. The bar on the right shows the number of SEs in that cluster. d A group of n = 254 SEs is highly active in the control or self-renewing cells and is gradually lost in the ATRA-treated differentiated cells. e A group of n = 174 SEs is specifically activated 2 Days after ATRA treatment. f A group of n = 355 SEs is specifically activated 4 Days after ATRA treatment. g A group of n = 157 SEs is specifically activated 8 Days after ATRA treatment. Box plots show the median with quartiles, whiskers show the 1.5 × interquartile range in the data, are from a single ChIP-seq experiment per time point, and are overlaid with the distribution shown as a violin plot. h Representative ChIP-Seq tracks for H3K27ac, H3K4me1, and H3K4me3 in EtOH and ATRA-treated cells in KCNR cells, showing loss of LMO1 SE after ATRA treatment harboring the protective rs2168101(G > T) SNP. i Bar graph of GATA3 ChIP-qPCR showing a relative decrease in GATA3 binding at specific LMO1 SE region following 4 days of ATRA treatment. P values were calculated with an unpaired, two-tailed t-test. Bars show the mean, with error bars representing the standard deviation. Source data are provided as a Source Data file. j Bar graph showing a relative decrease in LMO1 mRNA expression. P values were calculated with a paired two-sided student’s t-test. Bars show the mean, with error bars representing the standard error of measurement. Source data are provided as a Source Data file.

