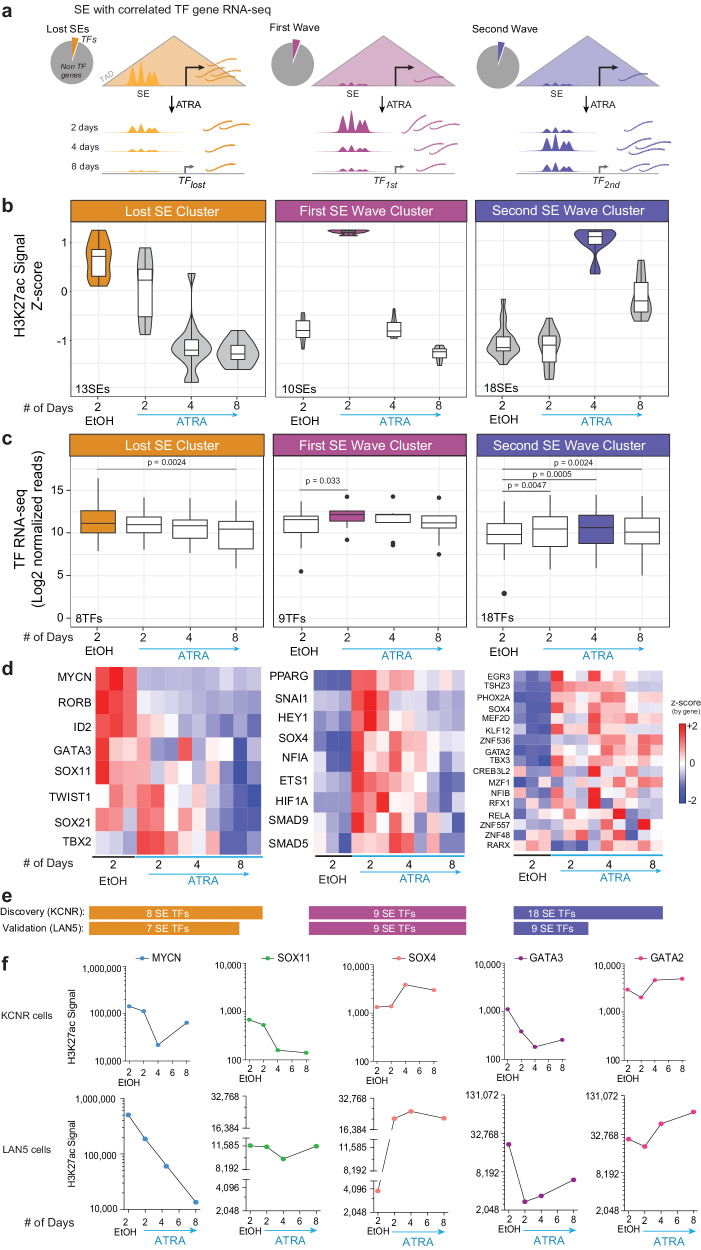
Fig. 2. SE-driven transcription factors drive the proliferation and differentiation of neuroblastoma cells.
a A schematic representation of the analysis steps following SEs identification in each cluster. As TFs drive the core regulatory circuitry of a cell, analysis was further restricted to SEs linked only to TFs (Pie charts), and their expression was evaluated at the mRNA level. b Violin plot showing the four clusters of SEs driving TFs (r2 ≥ 0.45) normalized by z-score of H3K27ac signal. The lost cluster consists of 13 SEs, the first wave cluster has 10 SEs, and the second wave cluster consists of 18 SEs. Data were from a single ChIP-seq experiment per time point. Box plots overlapping the violin plot depict the center line = median, box bounds = quartiles, whiskers = 1.5*interquartile range. c Box plots showing expression of the TFs driven by the SEs in each cluster. The 13 SEs in the lost cluster drives eight TFs where the loss in SE signal leads to a significant decrease in the expression of the corresponding TFs after 8 days of ATRA treatment. Similarly, gain in 10 SEs in the first wave cluster significantly increased expression of its downstream 9 TFs after 2 days and 4 days of ATRA treatment. And 18 SEs gained in the second wave led to significant gain in the expression of the downstream 18 TFs. P values were calculated with a paired, two-tailed t-test. Box plots depict the center line = median, box bounds = quartiles, and whiskers = 1.5*interquartile range. d Heatmap showing expression of individual TFs in each cluster in controls and after 2, 4, and 8 days of ATRA treatment in three biological replicates for each condition. Source data are provided as a Source Data file. e Number of SE-regulated TFs discovered in KCNR and validated in LAN5. f Line graph showing dynamic changes at specific SE with ATRA treatment in KCNR and LAN5 cells. H3K27ac signal at the SE associated with MYCN, SOX11, and GATA3 is decreased, whereas the signal at SOX4 and GATA2 are increased. ChIP-seq signal is normalized as reads per million mapped reads (RPM) summed over the entire SE region.

