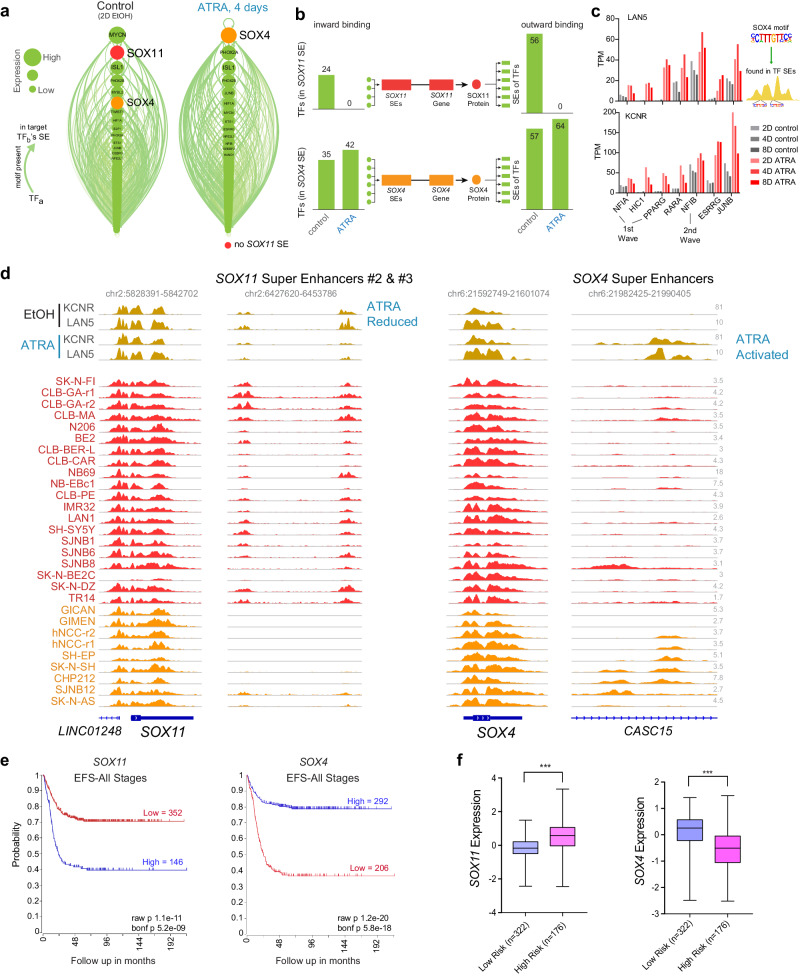
Fig. 3. Switching of lineage-specific transcription factors induces differentiation in NB cells.
a LEAF (Linked Enhancer-Activated Factors) plots of CRC linked by motif presence in their active enhancers, with nodes ranked by mRNA expression in descending order, in controls (EtOH treated), and 4 days of ATRA treatment. b Inward binding of NB TFs in SOX4 and SOX11 SEs (left) and outward binding in all TF proximal SEs (right) before and after ATRA treatment. Data were from day 4 in KCNR cells and is similar to connectivity at day 2, and is similar to observed changes in LAN5 cells. c Bar graph showing an increase in expression of the seven transcription factors that gain SOX4 inward binding after ATRA treatment. d ChIP-seq track of H3K27ac in ATRA-treated KCNR and LAN5 cells (top, gold), compared to group state epigenomics of H3K27ac in other Adrenergic NB cell lines and primary tumors (middle, red) and Mesenchymal NB cell lines and tumors (bottom, orange) at both SOX11 with one of its SEs, and SOX4 with its SE. e Kaplan–Meier plots based on the expression of SOX11 (left panel) and SOX4 (right panel) in tumors from NB patients at all stages (R2 database: SEQC dataset). P values were calculated with a log-rank test, with Bonferroni correction. f RNA expression of SOX11 and SOX4 among low and high-risk NB patients. ***P < 0.0001, two-sided students t-test with Welch’s correction. Data from R2 database: SEQC dataset. Box plots show a median with quartiles, and whiskers show the 1.5 × interquartile range.

