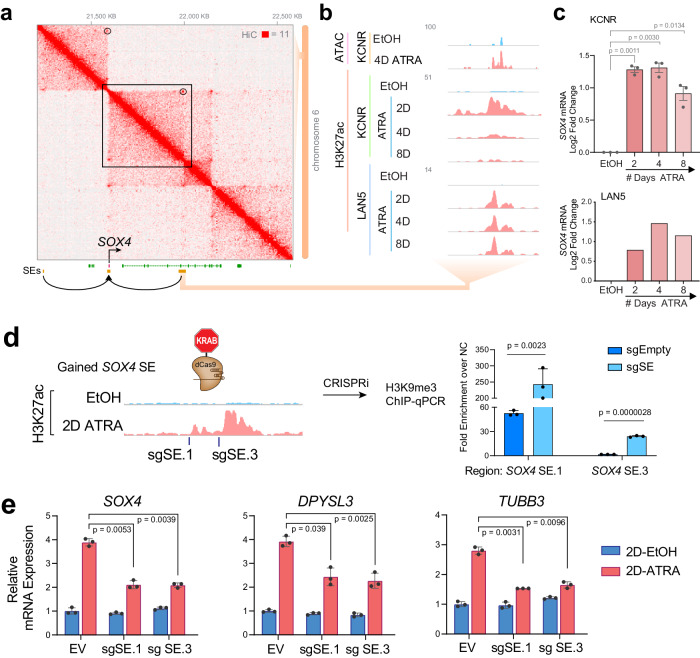
Fig. 4. SOX4 silencing leads to inhibition of RA-mediated differentiation of KCNR cells.
a Hi-C contact profile surrounding SOX4 locus in KCNR cells with gained SEs shown in both adjacent TADs. b Zoom in on the SE gained, intronic to CASC15. Representative ATAC-seq and ChIP-Seq tracks for H3K27ac in control (EtOH: blue) and ATRA-treated cells (pink), showing an increase in H3K27ac peaks at SOX4 SE in KCNR and LAN5 cells. c Bar graph showing relative mRNA levels (as normalized reads) of SOX4 after ATRA treatment in KCNR and LAN5 cells. A log2-fold change increase in SOX4 expression was observed post-ATRA treatment. In KCNR, data were means ± SD for n = 3 replicates; P values were generated from paired t-test with Welch’s correction. d Guided suppression of the gained SOX4 SE. Bar graph of H3K9me3 ChIP-qPCR showing increased H3K9me3 at specific gained SOX4 SE regions following CRISPR-dCas9-KRAB targeting of SOX4 SE. sgRNAs targeting SOX4 SEs were compared to empty vector (sgEmpty) and were performed in KCNR cells. P values were generated from paired t-test with Welch’s correction across n = 3 replicates. Bars show the mean, with error bars showing the standard deviation. Source data are provided as a Source Data file. e Bar graph showing suppressed SOX4 (left panel), DPYSL3 (middle panel) and TUBB3 (right panel) mRNA induction following CRISPR-dCas9-KRAB targeting of SOX4 SE. sgRNAs targeting SOX4 SEs were introduced into KCNR cells treated with control or ATRA for 2 days. EV empty vector. P values were generated from paired t-test with Welch’s correction across n = 3 replicates. Bars show the mean with error bars showing SEM. Source data are provided as a Source Data file.

