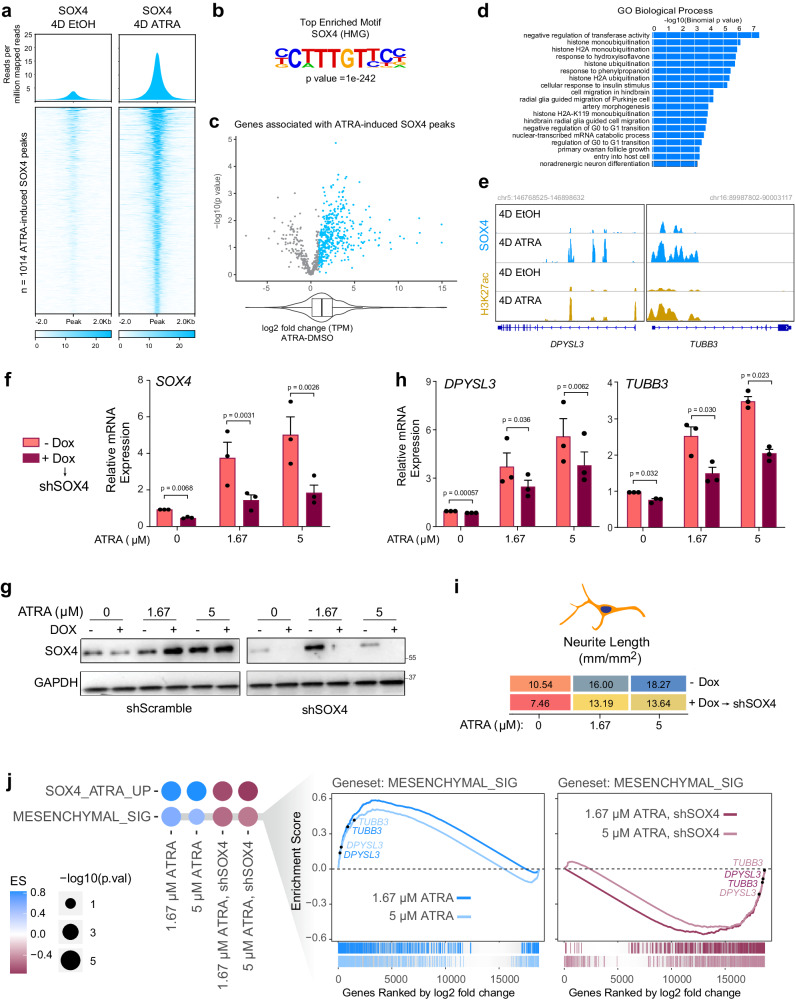
Fig. 5. ATRA-mediated differentiation leads to enhanced SOX4 binding on differentiation genes.
a SOX4 Cut and Run analyses showing an increase in SOX4 genome-wide binding after 4 days of ATRA treatment. Upper panel: Composite plots showing SOX4 signal intensities (reads per million mapped reads) at SOX4 high confidence peaks (n = 1014) in 4D EtOH (left) and 4D ATRA (right) treated cells. Lower panel: Heatmaps of SOX4 peak intensity at SOX4 high confidence peaks (n = 1014). Each row represents a genomic location and is centered around SOX4 peaks, extended 2 kb in each direction, and sorted by SOX4 signal strength. b Hypergeometric Optimization of Motif Enrichment (HOMER) analysis identified SOX4 binding motifs at SOX4 peaks using the HOMER package (homer.salk.edu/homer/ngs/peakMotifs.html). p statistic is calculated using the HOMER statistical comparison against size-matched DNA sequences from randomly selected background genomic sequences. c Volcano plot of log2 fold change (L2FC) of genes associated with ATRA-induced SOX4 peaks in KCNR cells. The box plot underneath and the overlapping violin plot depict the center line = median, box bounds = quartiles, and whiskers = 1.5*interquartile range. P values were calculated using the Wald test with Deseq2 across three biologically independent experiments. d Gene ontology terms associated with genes found using GREAT analysis (great.stanford.edu) on SOX4 constituent peaks. e Tracks showing an increase in SOX4 (blue) and H3K27ac (yellow) peaks after ATRA treatment at DPYSL3 and TUBB3 locus in KCNR cells. f qRT-PCR analysis showing relative mRNA levels of SOX4 (left) after doxycycline-induced inhibition. 50% inhibition of SOX4 mRNA was obtained after doxycycline treatment. The ATRA-mediated increase in SOX4 levels were also reduced ~60–70% on doxycycline treatment. P value were calculated using a paired ratio t-test across n = 3 replicates. Bars show the mean, error bars represent the standard error of measurement. g Western blots showing DOX-induced downregulation of SOX4 (via shRNA SOX4, right) during ATRA-induced expression of SOX4 (with shRNA scramble control on the left). Data were representative of n = 2 biological replicates. h SOX4 reduction slowed ATRA-induced activation of differentiation marker genes DPYSL3 (left panel) and TUBB3 (right panel). P value were calculated using a paired ratio t-test across n = 3 replicates. Bars show the mean, error bars represent the standard error of measurement. i Heatmap showing differentiation index as measured by neurite length. SOX4 silencing reduced ATRA-mediated differentiation of KCNR cells. j GSEA showing inhibition of ATRA-mediated mesenchymal signature upon silencing of SOX4.

