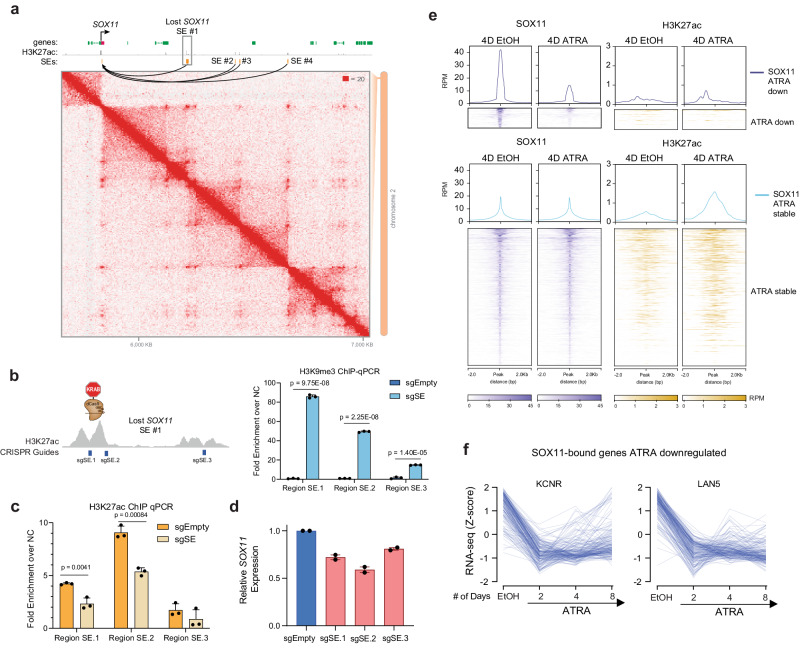
Fig. 6. SOX11 expression is regulated by SEs in NB cells.
a Hi-C contact map surrounding SOX11 locus in KCNR cells. Two lost SEs connected to the SOX11 TSS are highlighted, with the SOX11 gene and the largest lost SE (#1) labeled. b Left panel: Guided suppression of the lost SOX11 SE. Right panel: Bar graph of H3K9me3 ChIP-qPCR showing the mean relative increase in H3K9me3 peaks at specific SOX11 SE regions following CRISPR-dCas9-KRAB targeting, compared to empty vector (sgEmpty) in KCNR cells. P values were generated from paired t-test across n = 3 replicates. Bars show the mean, error bars represent the standard deviation. c Bar graph of H3K27ac ChIP-qPCR showing a relative decrease in H3K27ac at specific SOX11 SE region following CRISPR-dCas9-KRAB targeting. sgRNAs targeting SOX4 SEs led to a significant decrease in H3K27ac peaks compared to empty vector (EV) in KCNR cells. P values were generated from paired t-test across n = 3 replicates. Bars show the mean, error bars represent the standard deviation. d SOX11 mRNA levels (measured by RT-qPCR) decreased upon CRISPR-dCas9-KRAB mediated repression of SOX11 SEs in KCNR cells. Bars show the mean, error bars represent the standard deviation of n = 2 biological replicates. e Upper panel: Composite plots showing SOX11 (left) and H3K27ac (right) signal intensities (reads per million mapped reads) at SOX11 high confidence peaks in 4D EtOH (left) and 4D ATRA (right) treated cells. Middle and Lower panel: Heatmaps of SOX11 and H3K27ac peak intensity at SOX11 high confidence peaks. Each row represents a genomic location and is centered around SOX11 peaks, extended 2 kb in each direction, and sorted by SOX11 signal strength. f Line graph showing a decrease in expression of genes bound by SOX11 following 2, 4, and 8 days of ATRA treatment.

