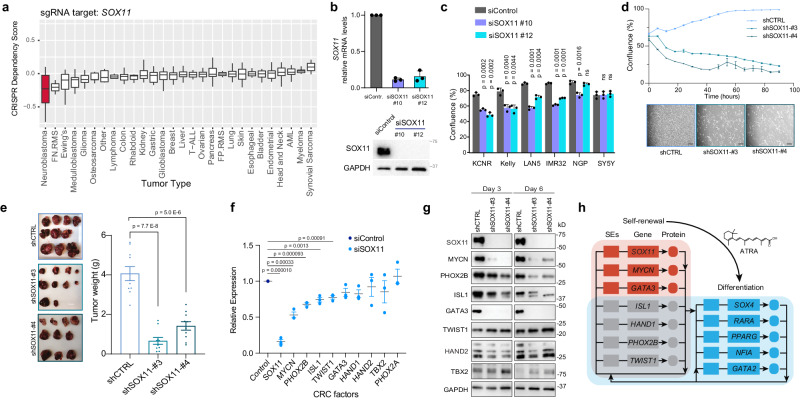
Fig. 7. SOX11 drives cell growth and proliferation of neuroblastoma cells.
a Bar graph showing the dependency of different cancer cells -on SOX11 for cell growth and proliferation. NB cells are most preferentially dependent on SOX11 for growth and proliferation compared to other tumor types. Data mined from Project Achilles genome-wide CRISPR-Cas9 screen. The number of cell lines in each tumor type are listed in Supplementary Dataset 9. Box plots show a median with quartiles, and whiskers show the 1.5 × interquartile range. b Upper panel: qRT-PCR analysis showing relative mRNA levels of the SOX11 after silencing for 48 h. Bars show the mean ± SEM of three replicates. Lower panel: The western blot shows inhibition of SOX11 at the protein level. c Multiple NB cells demonstrate significantly decreased cell growth after siRNA-mediated silencing of SOX11. Graph showing representative data from n = 3 biological replicates. P values were calculated with an unpaired, two-sided student’s t-test across three technical replicates. Bars show the mean, with error bars representing the standard deviation. d Upper panel: Line graph showing decreased cell growth after shRNA-mediated genetic inhibition of SOX11 (shSOX11#3 and shSOX11#4) in KCNR cells. Data were presented as the mean with error bars showing the standard deviation. Lower panel: Representative images of KCNR cells following genetic silencing either with control (shCTRL) or SOX11 specific shRNA (shSOX11#3 and shSOX11#4) at the 48 h time point. Scale bars are 200 µM. e Representative mouse tumor (left panel) and a bar graph (right panel) showing a significant decrease in tumor volume (weight) following shRNA-mediated genetic inhibition of SOX11. P values were calculated with an unpaired, two-sided student’s t-test with Welch’s correction. Bars show the mean, with error bars representing the standard deviation. f RT-qPCR analysis showing relative mRNA levels of known NB regulatory TFs after silencing of SOX11 for 48 h. Graph showing representative data from three biological replicates. P values were calculated with an unpaired, two-sided student’s t-test with Welch’s correction. The center line shows the mean, with error bars representing the standard deviation. g Western blot analysis showing protein levels of known NB regulatory TFs after 3 and 6 days of genetic inhibition of SOX11. h Model of CRC network swapping during ATRA-induced differentiation of NB. Genes highlighted were those which were consistently called in KCNR and LAN5 cells, both by enhancer analysis and gene expression changes. Lines represent inferred or verified binding by ChIP-seq, and do not necessarily indicate that such SE binding is an essential positive regulation event.

