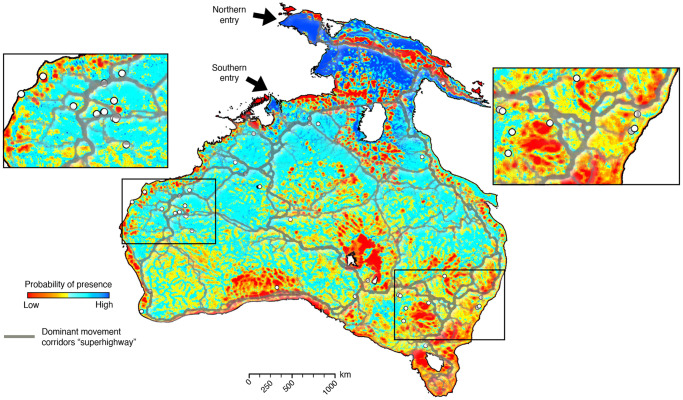
Fig. 6. Probability of Lévy walkers’ presence across Sahul combining the northern and southern entry points.
Heat map of Sahul walkers’ distribution estimated by merging the results from the mechanistic simulations (two entry points each based on 5000 realisations with 10 million walker steps by realisation). The number of walkers from all simulations are aggregated in 0.05◦ cells (~5 km). Cyan to blue areas correspond to regions with high probability of presence and red to yellow areas are regions which are never or rarely chosen. White circles indicate locations of archaeological sites (Supplementary Table 1). Grey lines overlaying the map show the dominant movement corridors calculated with least-cost pedestrian travel model9 and interpreted as the major pathways - superhighways - of human migration across Sahul prior to 50 ka2,9. Maps are produced with the open-source python interface for the Generic Mapping Tools (https://www.pygmt.org) based on paths generated with SimRiv software.

