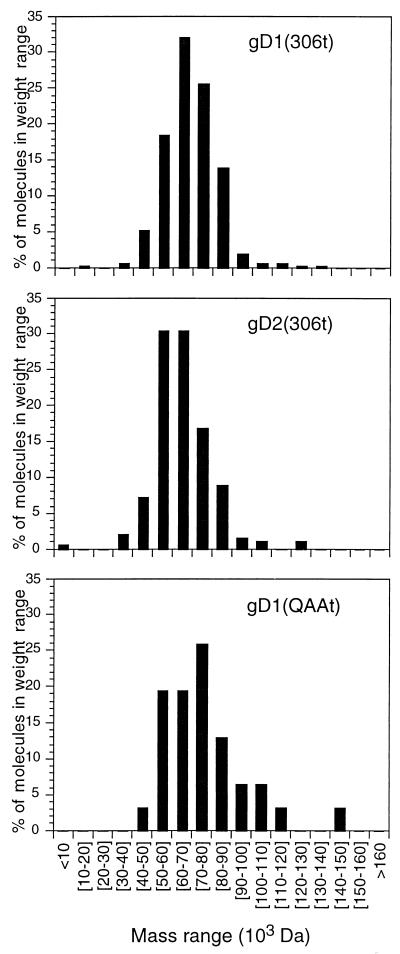
FIG. 2.
STEM. Individual molecules of protein were directly viewed, and molecular masses were calculated by comparison to a tobacco mosaic virus standard. The range of molecular masses for each protein was plotted on a histogram as percentages of the total numbers of particles counted. The average molecular masses are reported in Table 1.

