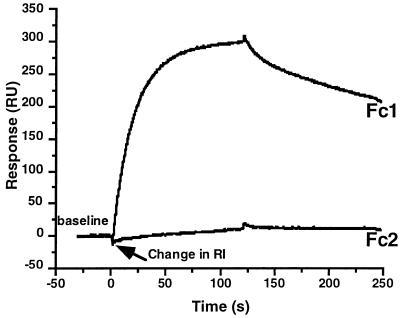
FIG. 3.
Example of raw sensorgram data. gD1 (Δ290-299t) at a concentration of 0.5 μM was injected over a surface containing 2,000 RU of HveAt (Fc1) in series with a blank surface (Fc2). At 120 s, the sample was replaced with buffer, and dissociation followed for 2 min. The change in refractive index (RI) represents a difference in solution composition between the buffer and the protein solution.

