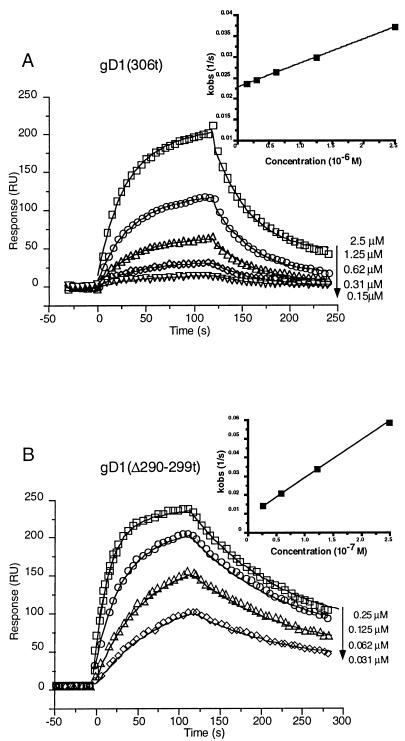
FIG. 4.
Corrected sensorgram overlays for the gDt-HveAt interaction. (A) Repeat injections of gD1 (306t) at the indicated concentrations are represented by the small symbols. Data were collected at 5 Hz, but for clarity, one point per second is shown. The solid lines represent the best fits found by the global software analysis. The inset represents a plot of kobs versus concentration, the negative slope of which is equal to kon. The R2 for the linear fit of the data was 0.999. (B) Repeat injections of gD1 (Δ290-299t) at the indicated concentrations. Data collection and analysis were the same as described for panel A. The R2 for the linear fit of the data in the plot of kobs versus concentration (inset) was 0.999.

