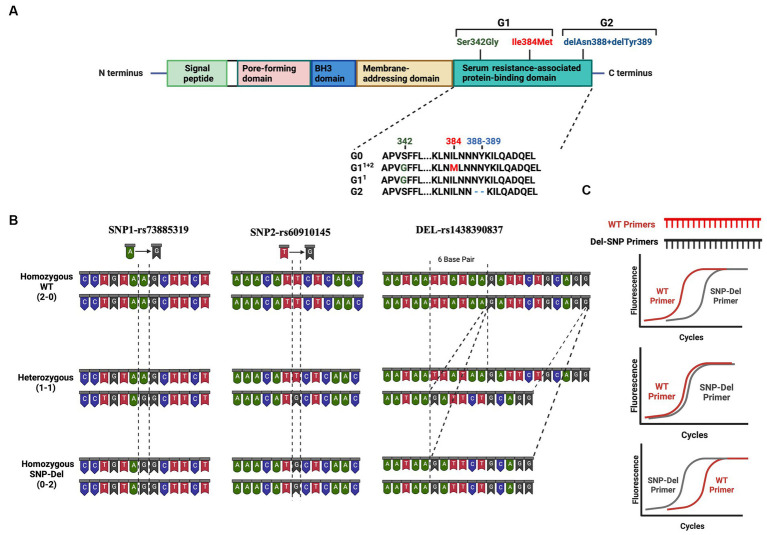
Figure 1.
Risk Variants of the APOL1 gene (A) Graphical representation of the APOL1 protein showing its domains and the location of the G1 and G2 variants in the SRA domain (B) Representation of the base changes at individual SNP and deletion sites. DNA structures for homozygous wild-type (2–0), heterozygous (1–1), and homozygous SNP/deletion (0–2) variants are shown in three panels. (C) Predicted results of qPCR analysis using our probe-independent real-time quantitative PCR approach. This figure has been generated with Biorender program.

