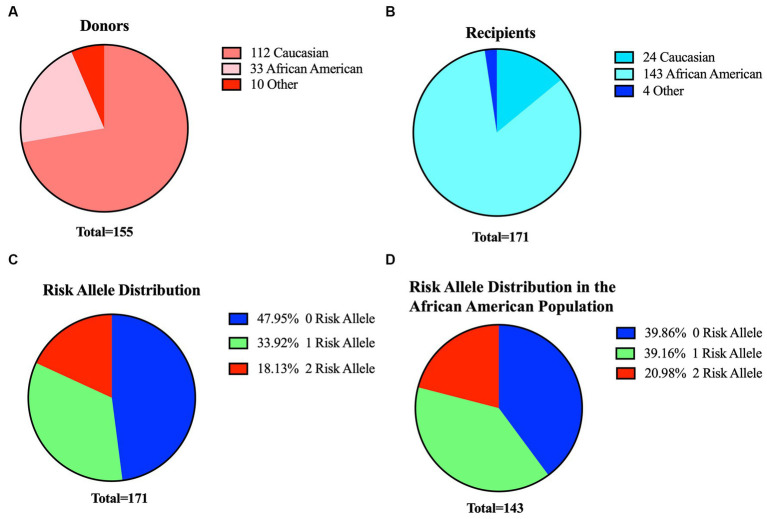
Figure 3.
Profiles of donors and recipients in our cohort and overview of risk metrics for recipients. Distribution of donors (A) and recipients (B) based on their ethnicity. (C) Distribution of APOL1 risk variants among the 171 recipients in our study (D). Risk allele distribution for African-American recipients only (n:143) in the cohort. Blue:0-risk, green:1-risk, red:2-risk.

