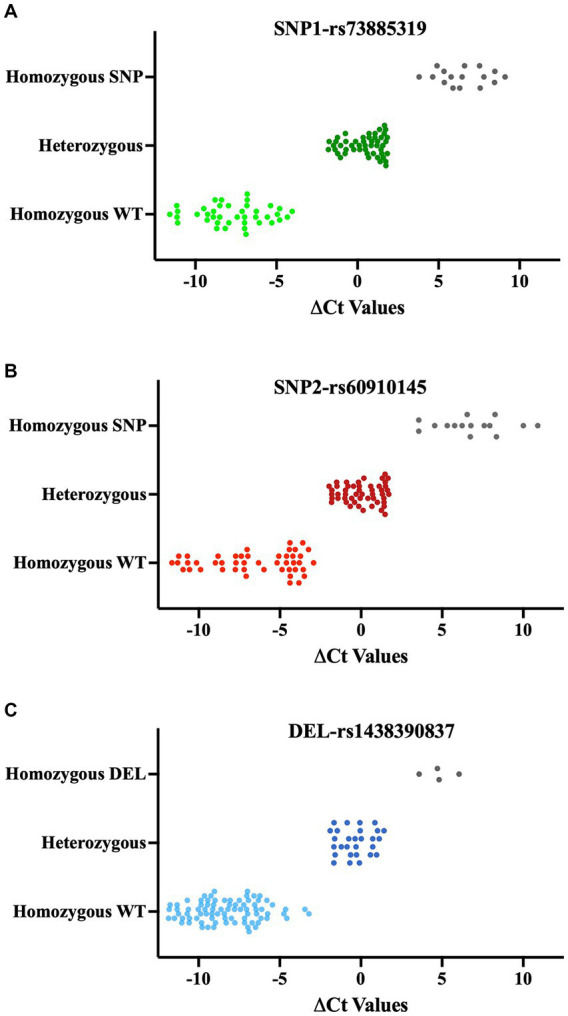
Figure 5.

ΔCt values of QPCR results for SNPs (A, B) and deletions (C). qPCR results of each SNP and deletion are classified based on Sanger Sequencing results. Each data point shows the mean of ΔCts values (ΔCt = Ct value with modified WT primer- Ct value with modified SNPs/Del primer). Lighter color: Homozygous WT, Darker color: Heterozygous, Gray: Homozygous SNP or Deletion.
