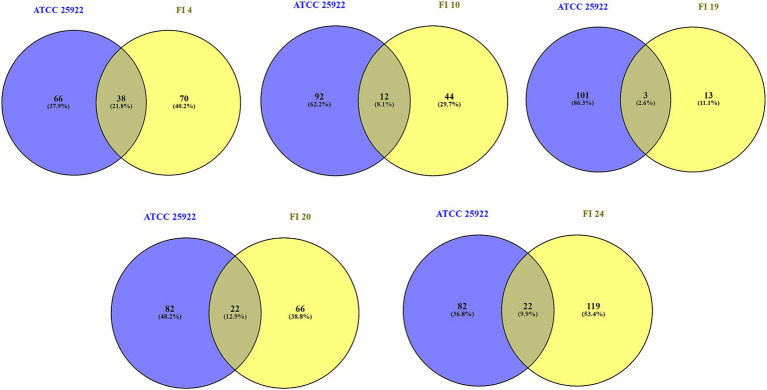
Figure 2.
Overlap between differentially expressed proteins (log2 fold change >1 and <−1, p-value < 0.05) following exposure to ciprofloxacin (1xMIC relative to each wild-type) between isolates with suppressed SOS response relative to wild-type and the control strain in the same conditions. Venn diagrams show the overlap. Numbers on the diagram refer to the number of proteins with significantly altered expression levels. Susceptible phenotype: FI 10; LLQR phenotypes: FI 4 and FI 20; Resistant phenotype: FI 19 and FI 24.

