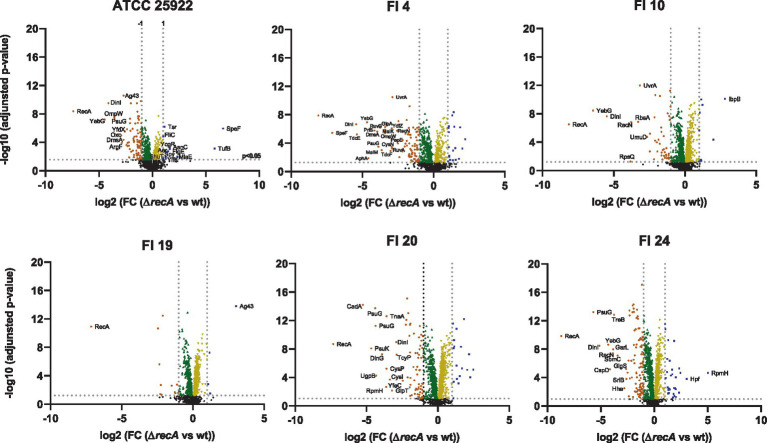
Figure 3.
Proteome profile by strain. Orange: Proteins with log2 fold change (FC) < −1; Blue: Proteins with a log2 FC > 1; Green: Proteins with log2 FC = 0 to −1; Yellow: Proteins with log2 FC = 0 to 1. Black: no significant proteins (p > 0.05). Labeled proteins with log2 FC between >2.5 and < −2.5. wt, wild-type.

