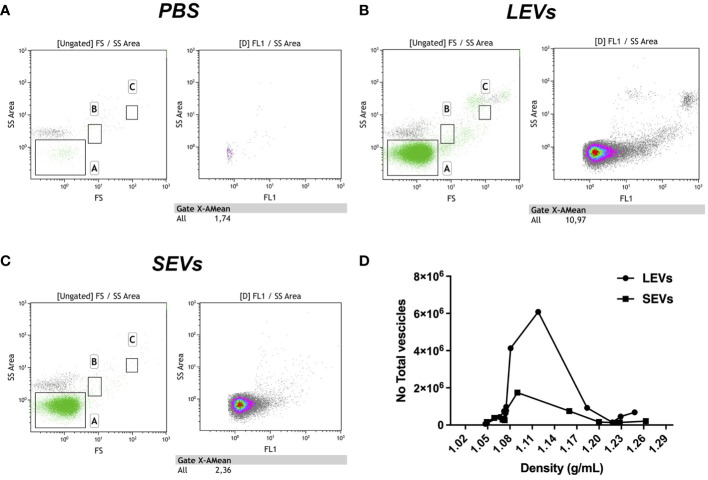
Figure 5.
Flow cytometry analysis of gradient fractions of LEVs and SEVs. (A) PBS buffer used to resuspend EVs as negative control. (B) Dot plot of LEVs fraction at 1.1 g/ml density. (C) Dot plot of SEVs at 1.1 g/ml density. (D) diagram comparing the distribution of LEVs and SEVs in the gradient fractions. Left panels indicate gate dimensions (A ≤ 200 nm, B=500 nm and C=1 µm). Right dot plot panels show vesicles distribution in terms of fluorescence.

