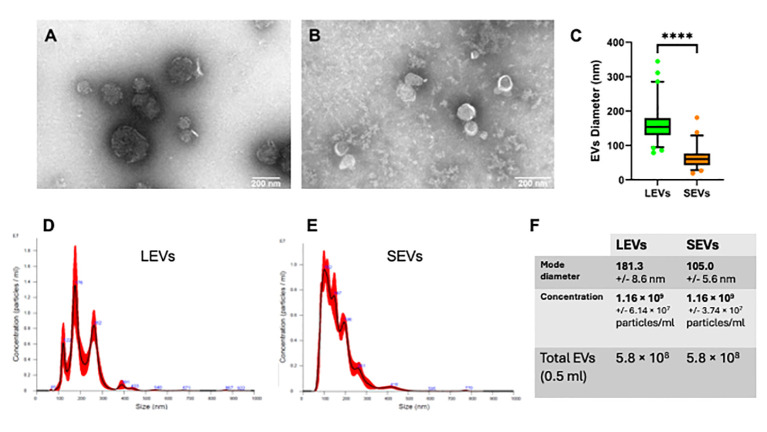
Figure 6.
Physical characterization of LEVs and SEVs by electron-microscopy and nanoparticle tracking analysis (NTA). (A) TEM negative staining of LEVs. (B) TEM negative staining of SEVs. (C) graph showing the vesicle size distribution in LEVs (green) and SEVs (orange). Statistical analysis was based on TEM micrographs; dots indicate maximum and minimum values (****=p-value<0.0001, Mann-Whitney test). (D) graph showing the size distribution of LEVs as dtermined by NTA. (E) graph showing the distribution of SEVs as determined by NTA. (F) table reporting the mode diameter, the concentration of LEVs and SEVs, the total number of EVs (LEVs or SEVs) in 0.5 ml as determined by NTA.

