Figure 2.
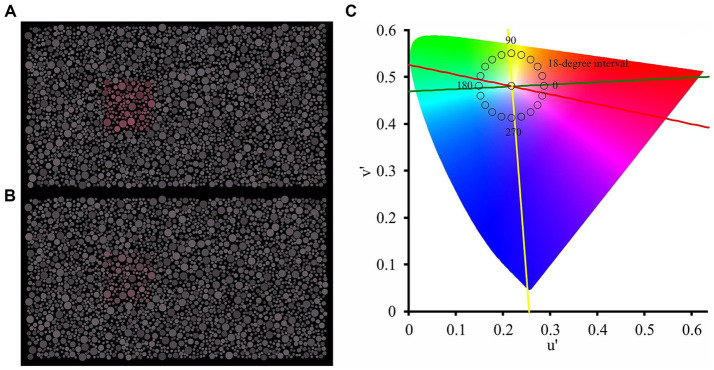
Visual stimulation used in the first stage (A) and second stage (B) of the chromatic discrimination test. The chromaticity of the target was displayed along 20 chromatic axes spaced at 18-degree intervals in the CIE-1976 color space (C). Yellow line represents the titran confusion line, Red line represents the protan confusion line, and Green line represents the deutan confusion line.

