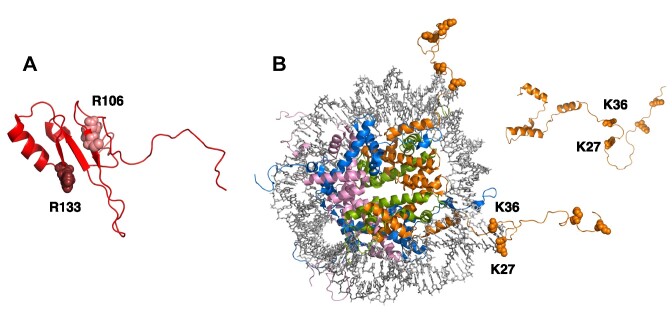
Figure 10.
Structural models for MBD and H3. (A) AlphaFold model for the structure of MBD (UniProt: A0A075BPH5) showing the location of the two Rett syndrome associated mutations studied in this work: R106 (light red) and R133 (dark red). (B) Structure of the nucleosome (PDB code: 1kx5), showing the histone octamer as cartoon model (histones in different colors, H3 in orange) and the dsDNA as stick model (grey). The AlphaFold model for the isolated histone H3 (UniProt: B4E380) is also shown as an inset. Lysines K4, K9, K27 and K36 are shown as sphere model. Lysines K27 and K36 are located close to the nucleosomal dsDNA.

