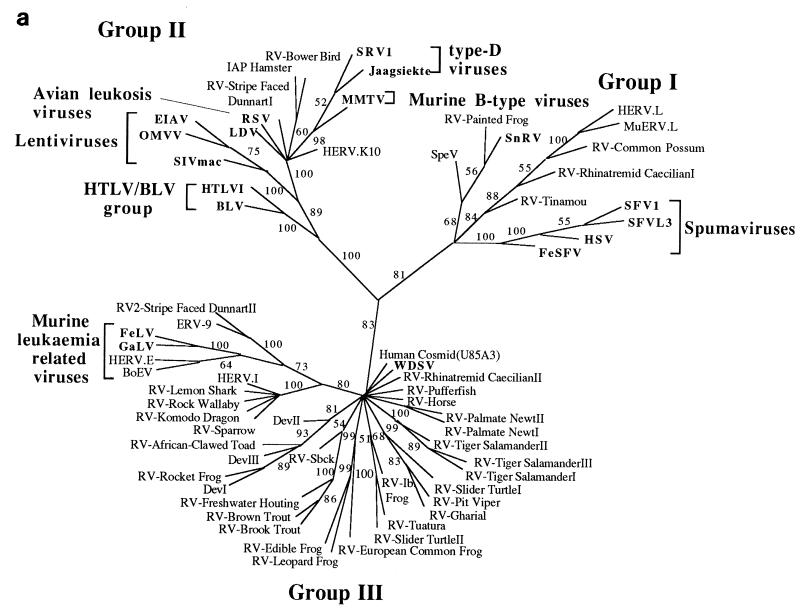
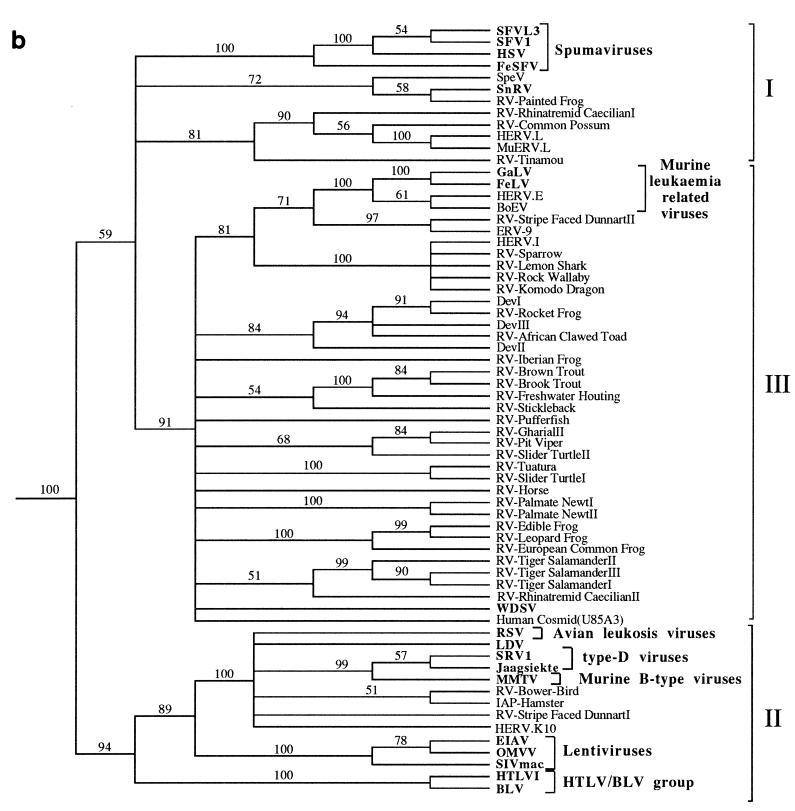
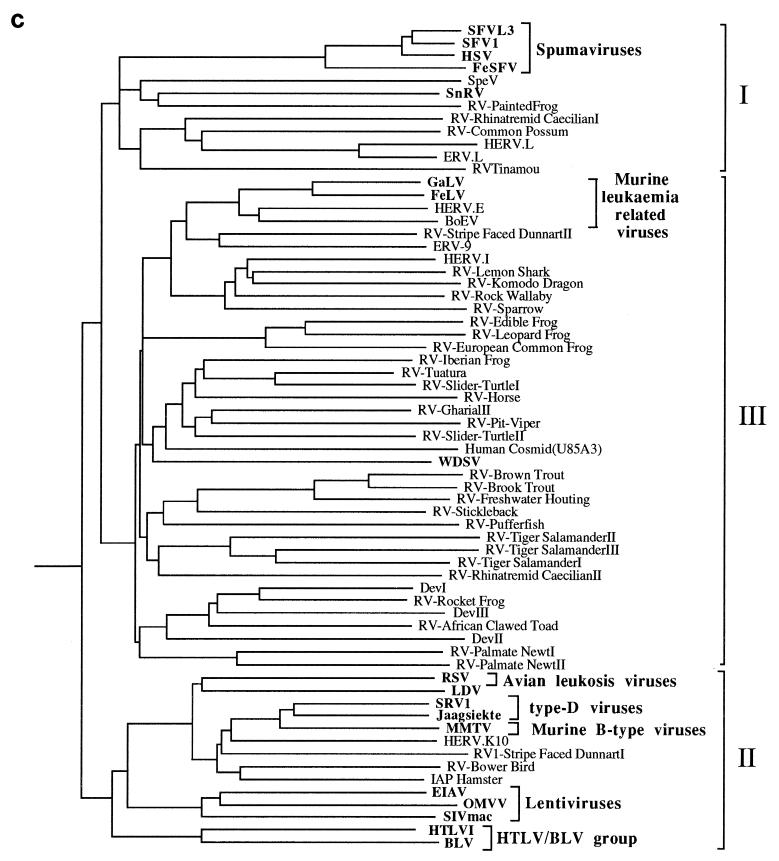
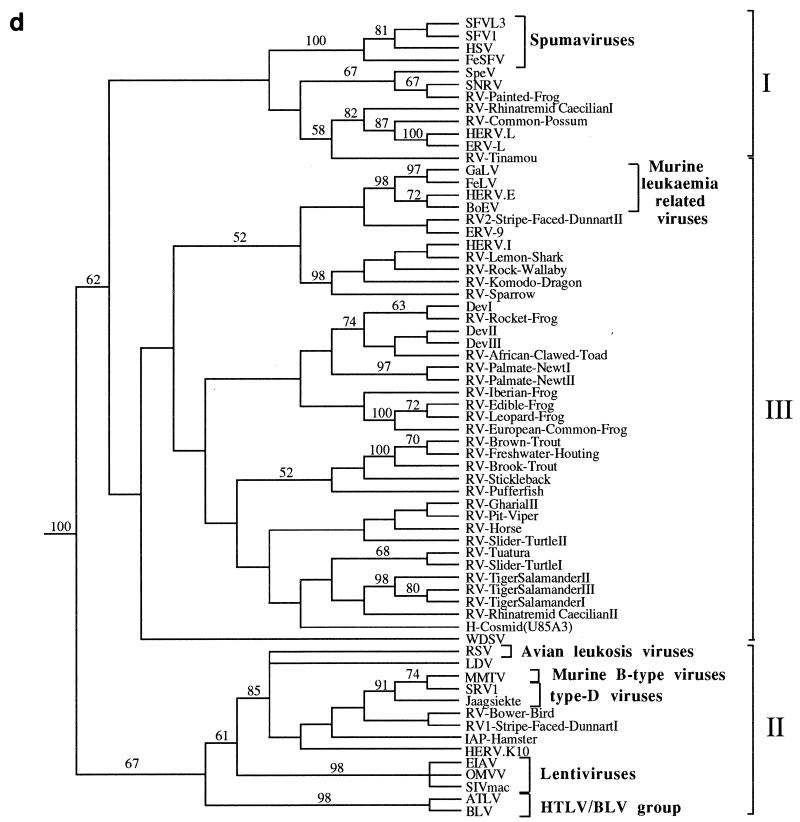
FIG. 3.
Phylogenetic trees of the retroviruses based on the alignment shown in Fig. 2, with the addition of 30 residues derived from the protease protein. Exogenous isolates are indicated by bold type. The genera to which particular retroviruses have been assigned are also shown. (a) Unrooted neighbor-joining bootstrap tree. The figures on each branch represent bootstrap support (from 1,000 replicates), with percentage values on only those branches with support greater than 50 being shown. Unresolved branches are shown as polytomies. (b) Neighbor-joining tree rooted on several gypsy LTR retrotransposon sequences (gypsy, Del, Ty3, and micropia), with figures on each branch again showing percentage bootstrap support (1,000 replicates). (c) Rooted neighbor-joining tree with branch lengths proportional to the genetic distance between the sequences. The tree is rooted as described in the legend to panel a. (d) Strict consensus of six equal-length trees identified by maximum parsimony. Bootstrap values were generated from 100 replicates (each of 25 random-sequence additions) by using the unordered matrix. The tree is rooted as described in the legend to panel a.


