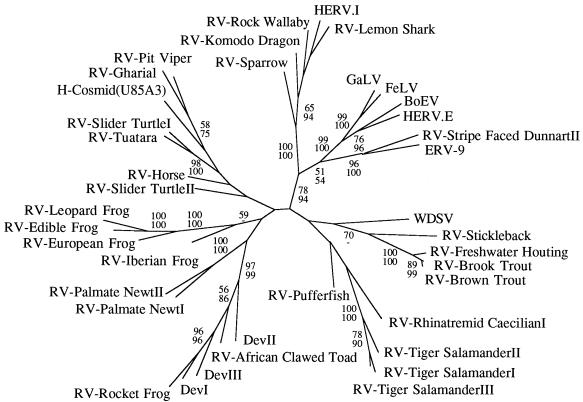
FIG. 4.
Unrooted maximum parsimony tree of the group III viruses shown in Fig. 3. Branch lengths are proportional to the number of changes required to generate the observed variation. Numbers on each branch reflect percentage bootstrap support using maximum parsimony (upper value) or neighbor-joining (lower value).

