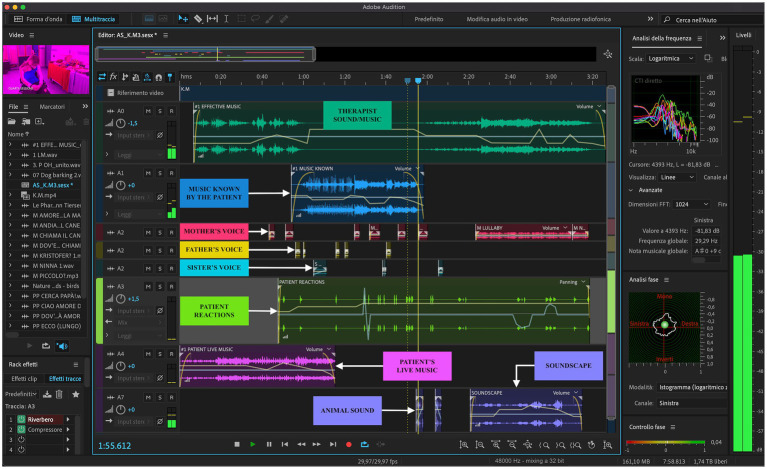
Figure 2.
An example of a custom composition. The left axis of the image shows the edited video clip of the sessions, the library of audio clips, the effects applied to tracks, and at the bottom are indicated the start, end, and duration of the project; at the top, there is the timeline expressed in decimal time format (mm:ss.ddd); on the right axis there are the Frequency Analysis, the Phase Analysis, the Phase Control, and the Level Meter; the bottom shows the Mixer and the effect panels, and finally, the Sample Type in the status bar indicates the 48,000 Hz sample rate, the 32-bit depth, and the buffer size of 1,024.

