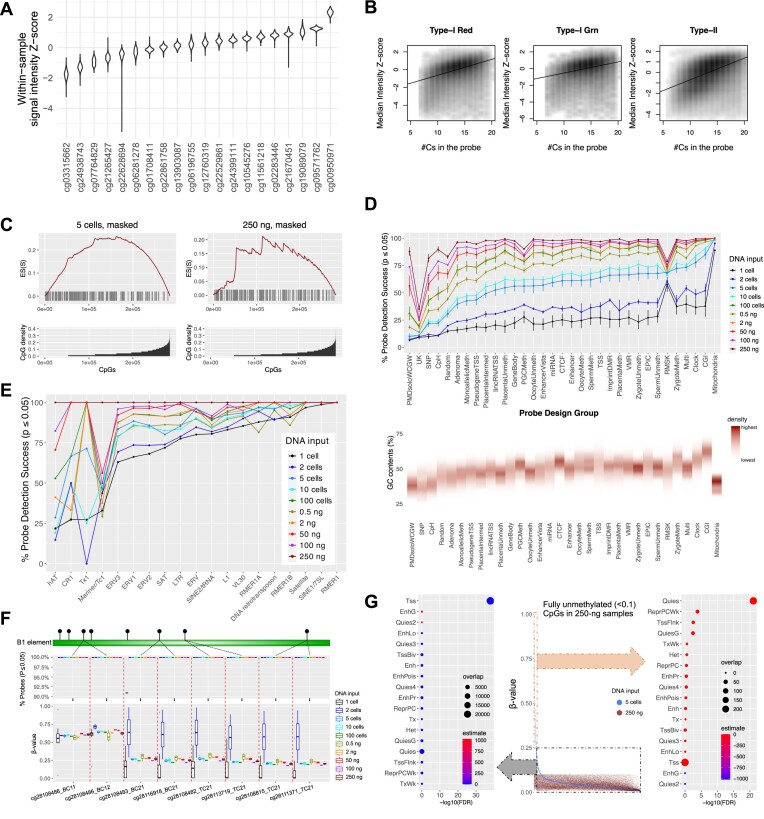
Figure 4.
Low-input Infinium array preferentially loses detection on GC-sparse genome but retains detection on mitochondria and TEs. (A) Violin plot for intensity Z-score of representative HM450 autosomal probes across 749 normal samples from the TCGA cohort. (B) Correlation of signal intensities with the number of Cs in the probe sequence. (C) CpG density enrichment analysis for NIH3T3 5-cell and 250-ng datasets. (Bottom) The x-axis represents probes (N = 297 415) organized in ascending order based on their CpG density. Y-axis indicates the CpG density for each probe. (Top) The x-axis aligns with the bottom plot, and the y-axis exhibits the enrichment score (ES). Each bar in the figure depicts the location of a pOOBAH-masked probe, arranged in ascending order of CpG density within a ±75 bp range of the flanking region surrounding the CpG target for each probe. (D) The mean and standard deviation (with error bars) of the probe success rate of probe design groups (a complete description of the definition of each probe design group is listed in the legend of supplementary Figure S4) (top). Flanking GC content ratios of probes on mouse methylation array within a range of ± 50 bp, categorized by probe design groups (bottom). (E) the mean of the probe success rate of TEs for varying DNA input amounts, ranging from single-cell to 250 ng datasets. The x-axes are organized in ascending sequence according to the probe success rates for five cells in (D) and single cells in (E). (F) (top) The probe detection rates of eight CpG probes targeting B1 elements ranged from single cells to 250 ng, and (bottom) corresponding beta values cover the same range. (G) The beta value distribution of CpGs in the 5 cells of NIH3T3 with blue dots, emphasizing fully unmethylated (less than 0.1 of beta values) in the 250-ng sample, represented by red dots (center). The x-axis was organized in descending order of beta values of the 5 cells. Dot plots for enriched chromatin states (75) for CpGs within the dashed gray square with delta beta less than 0.25 between the two samples (left), and CpGs within the dashed orange square with delta beta greater than 0.25 (right). Estimate: log2 of Odds ratio; overlap: number of curated CpG probes for each term of chromatin state.

