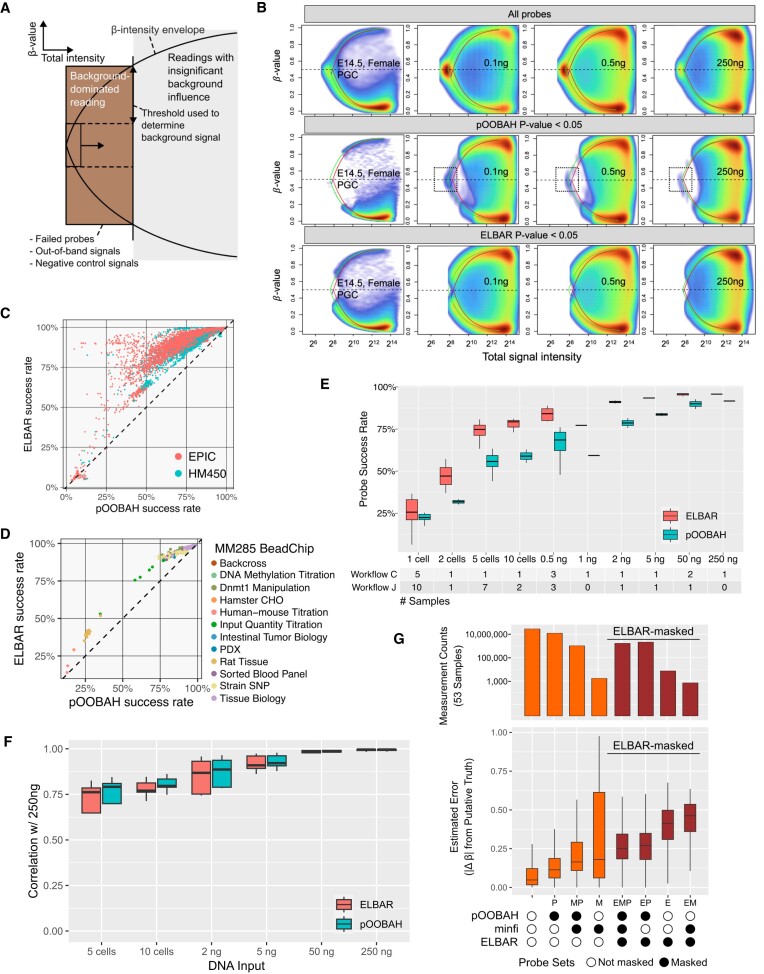
Figure 5.
ELBAR detection preserves more probes with biological signals. (A) A schematic illustration of the ELBAR algorithm. The x-axis represents the total signal intensity, and the y-axis represents beta values. (B) Performance of ELBAR in eliminating background-dominated reading probes compared to pOOBAH and unfiltered in PGCs, 0.1-, 0.5- and 250-ng-input datasets. Dashed boxes illustrate the artificial, background-dominated readings left by pOOBAH masking. The green and red curves denote the beta value envelopes defined by the green and the red channel background signal, respectively. (C, D) ELBAR performance regarding the probe success rates for public human (C) and mouse (D) array datasets. (E, F) Comparison of ELBAR performance with pOOBAH regarding probe success rate (E, P-value = 2.7E-8, t-test of method difference in a multiple linear regression) and Spearman's rho (F, P-value = 0.71, t-test of method difference in a multiple linear regression) in low-input datasets with DNA input ranging from single cell to 250 ng. (G) Comparisons of three probe masking methods: (top) the total number of readings surviving detection masking from 53 FFPE samples, and (bottom) the methylation reading deviation from putative ground truths in these 53 samples.

