Figure 3.
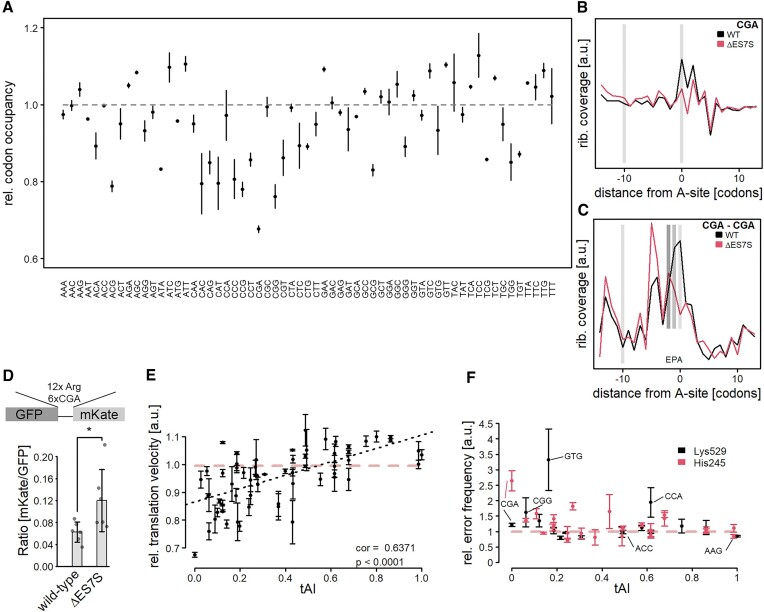
Slow codons are translated at a higher pace due to misincorporations of amino acids. (A) Ribosome profiling was performed on wild-type and ΔES7S cells and A-site occupancies were determined as described in (Nedialkova & Leidel, 2015). Data are shown as the ratio of ΔES7S over wild-type occupancies. Dots indicate the mean ratio and arrows indicate the standard deviation from three biological replicates. (B) CGA codon positions were extracted transcriptome-wide and occupancies surrounding the codon were measured for wild-type and ΔES7S ribosomes. Local intensities within the region were normalized to total intensities. Light grey bars indicate the position of the A-site at position 0 and the A-site of a potentially stalled ribosome at position −10. (C) CGA dicodons were extracted transcriptome-wide and surroundings were analyzed as in (B). Dark grey bars indicate the P-site and E-site of ribosomes located on dicodons. (D) CGA stalling assays were performed in wild-type and ΔES7S cells and mKate/GFP ratios were calculated. Bars indicate the mean ± SD. Individual points show the underlying data. (E) The relative A-site occupancy (ratio of A-site occupancy based on calibrated ribosome profiling data from ΔES7S over wild-type; a ratio of 1 indicates no changes in A-site occupancy) is plotted as a function of the tRNA adaptation index (Chan & Lowe, 2016). Data are shown as mean ± SD. The grey dashed line indicates no difference between wild-type and ΔES7S occupancies. Stars indicate the significance of differences as determined by Student's t-test (n = 6, * P ≤ 0.05). (F) Double-luciferase assays were performed to quantify the mistranslation of specific codons in the active-site residues K529 and H245 of Firefly Luciferase. Relative error rates (ratio of ΔES7S over wild-type; mean ± 95% confidence interval) are shown as a function of the tRNA adaptation index. The red, dashed line indicates no difference in error rates.

