Figure 4.
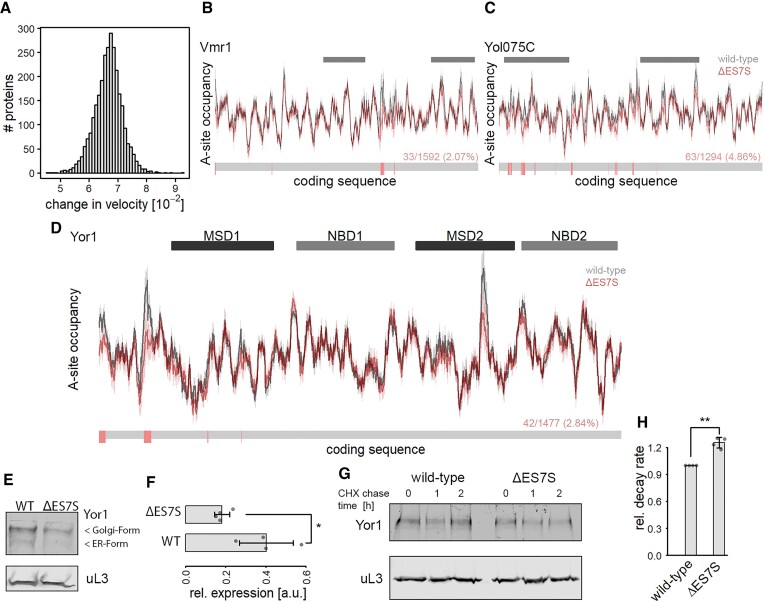
ΔES7S-induced changes in local translation rates modulate ABC-transporter properties. Global changes in translation speed were calculated based on each transcript's coding sequence. (A) Distribution of absolute changes in translation speed transcriptome-wide. (B) Translational profile of the ABC-transporter Vmr1. Grey bars indicate the positions of transmembrane domains. (C) Translational profile of the ABC-transporter Yol075C. Grey bars indicate the positions of transmembrane domains. (D) Translational profile of the ABC-transporter Yor1. Dark and light grey bars indicate the positions of transmembrane and nucleotide-binding domains respectively. (B–D) The lower bar indicates positions with significantly increased translation velocity in red and unchanged velocity in grey. The numbers give the number of accelerated positions as compared to the total number of amino acids. The significance was calculated based on differences in A-site occupancies from individual experiments (n = 3). (E) Western blot of HA-tagged Yor1 protein. Steady-state protein levels of Yor1 (upper panel) and uL3 as a loading control are shown. (F) Quantification of western blot signal from Yor1 normalized to uL3 signal (n = 4; * P ≤ 0.05, Wilcoxon Rank Sum test). (G) Western blot analysis of Yor1 protein isolated from cycloheximide chased cells for the indicated times. uL3 served as a control. (H) Relative Yor1 decay rates of wild-type and ΔES7S cells were calculated from immunoblot signals of cycloheximide chased cells in (G).

