Figure 2.

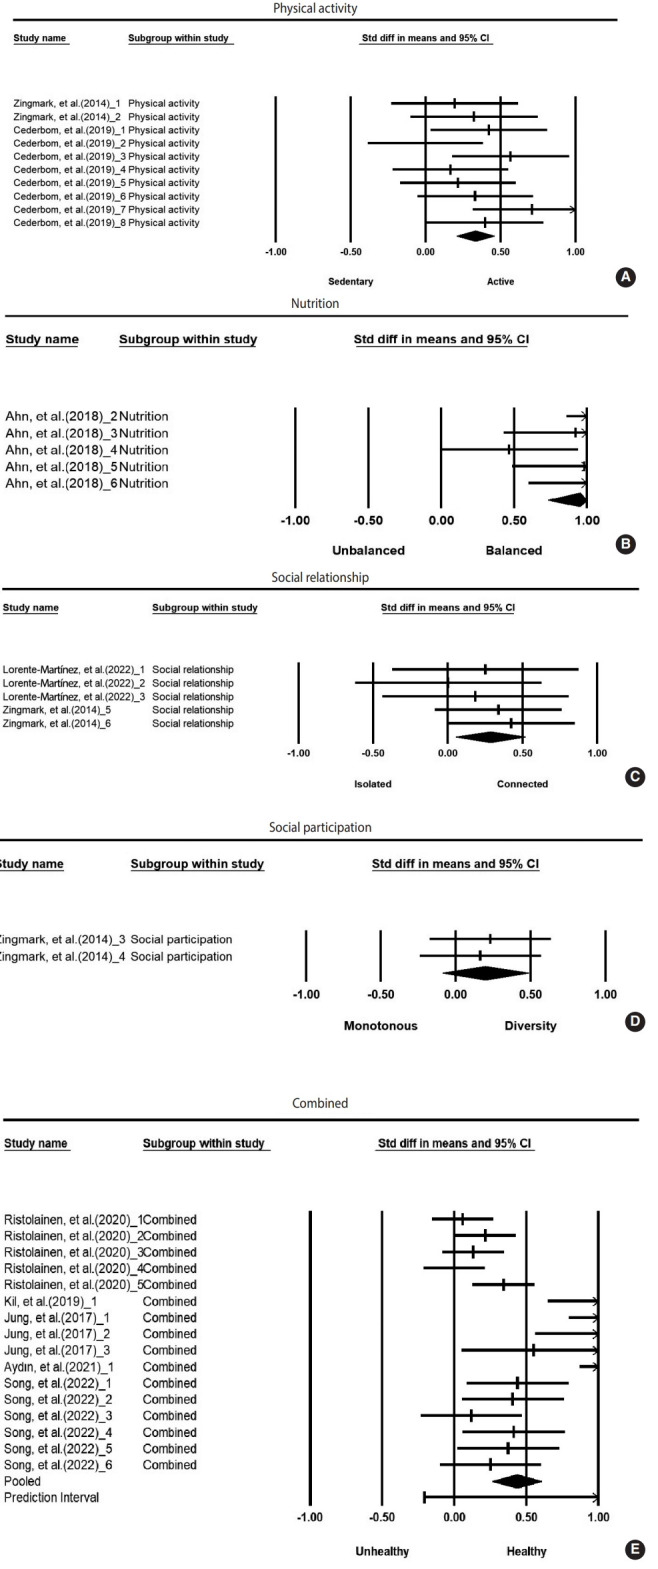
Forest plots for each type of intervention (A) physical activity, (B) nutrition, (C) social relationship, (D) social participation, and (E) combined. Std diff, standard difference; CI, confidence interval.

Forest plots for each type of intervention (A) physical activity, (B) nutrition, (C) social relationship, (D) social participation, and (E) combined. Std diff, standard difference; CI, confidence interval.