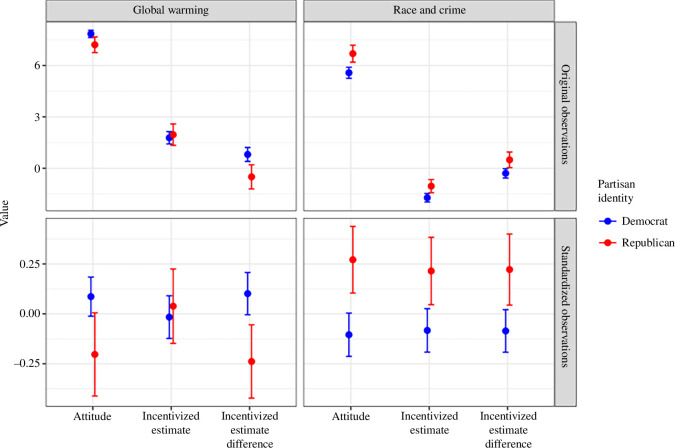
Figure 1.
Distribution of the key variables measured in stages 1–3 by partisan identity and issue. Dots represent means and whiskers indicate 95% confidence intervals (CIs) of the mean. The top row shows the response on the scale at which the measures were taken, and the bottom row shows standardized values to enable comparison across questions and measures.

