
Figure 4.
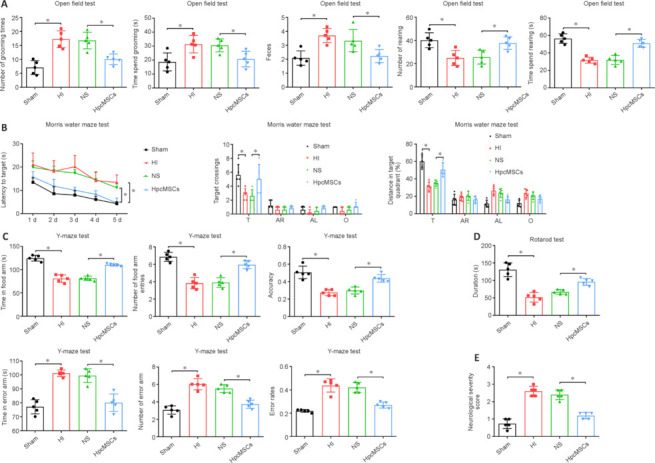
Neurological evaluations of rats at 2 months after hpcMSCs transplantation.
(A) Quantification diagrams for the number of times grooming, time spent grooming, number of feces, number of rearing, and the time spent rearing in the open field test. (B) Quantification diagrams for latency to target, number of target crossings, and distance traveled in target quadrant in the Morris water maze test. (C) Time spent in food arm, number of food arm entries, accuracy, time spent in error arm, number of error arm entries, and error rate in the Y-maze test. (D) The duration in the rotarod test. (E) The neurological severity scores. All data are presented as mean ± SD (n = 5/group). *P < 0.05 (one-way analysis of variance followed by Tukey's post hoc test). AL: Adjacent left quadrant; AR: adjacent right quadrant; HI: hypoxia-ischemia; hpcMSCs: human placental chorionic derived mesenchymal stem cells; NS: normal saline; O: opposite quadrant; T. target quadrant.