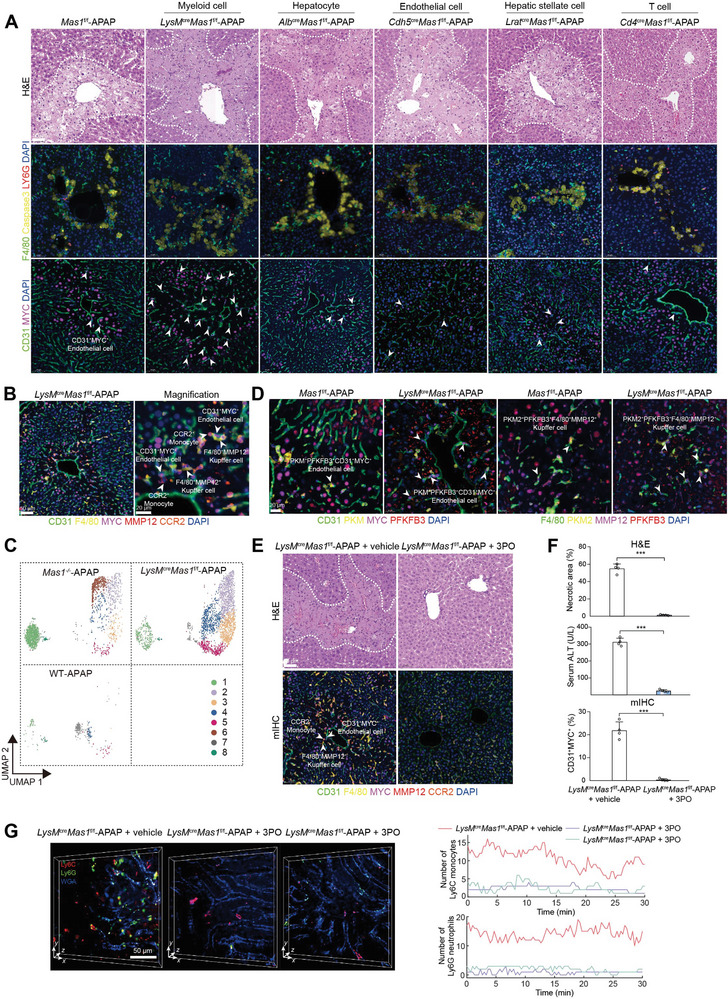
Figure 4.

Myeloid Mas modulates AILI through the highly pro‐inflammatory and glycolytic microenvironment. A) Mas1 f/f, LysM cre Mas1 f/f, Alb cre Mas1 f/f, Cdh5 cre Mas1 f/f, Lrat cre Mas1 f/f and Cd4 cre Mas1 f/f mice were administrated with APAP for 24 h (n = 6 mice per group). Representative stainings of H&E and mIHC are shown. Scale bar: 50 µm. B) mIHC of CD31+MYC+ ECs, F4/80+MMP12+ Mψ, and CCR2+ monocytes are shown. Scale bar: 50 µm and 20 µm. C) The UMAP plot showing the subpopulation of Mψ. D) mIHC of CD31+MYC+ ECs, F4/80+MMP12+ Mψ, and key glycolytic enzymes (PKM and PFKFB3). Scale bar: 20 µm. E) LysM cre Mas1 f/f mice were pre‐administrated with or without 3PO before APAP challenge (n = 4 per group). Representative stainings of H&E and mIHC are shown. Scale bar: 50 µm. F) Quantification of necrotic area for H&E as shown in E (n = 4 mice per group; two‐sided Student's t‐test, p = 9.53 × 10⁻⁷), serum ALT (n = 4 mice per group; two‐sided Student's t‐test, p = 3.77 × 10⁻⁷) and quantification of CD31+MYC+ ECs for mIHC as shown in E (n = 4 mice per group; two‐sided Student's t‐test, p = 2.70 × 10⁻⁵). G) Timelapse data of neutrophils (Ly6G) and monocytes (Ly6C) in the vessels (WGA) of living mouse livers were captured by DAOSLIMIT. Representative intravital images and the temporal traces of their number are shown. LysM cre Mas1 f/f mice were pre‐administrated with or without 3PO before APAP challenge. Scale bar: 50 µm. In all graphs, data are presented as mean ± SD, ***p < 0.001.
