
Figure 6.
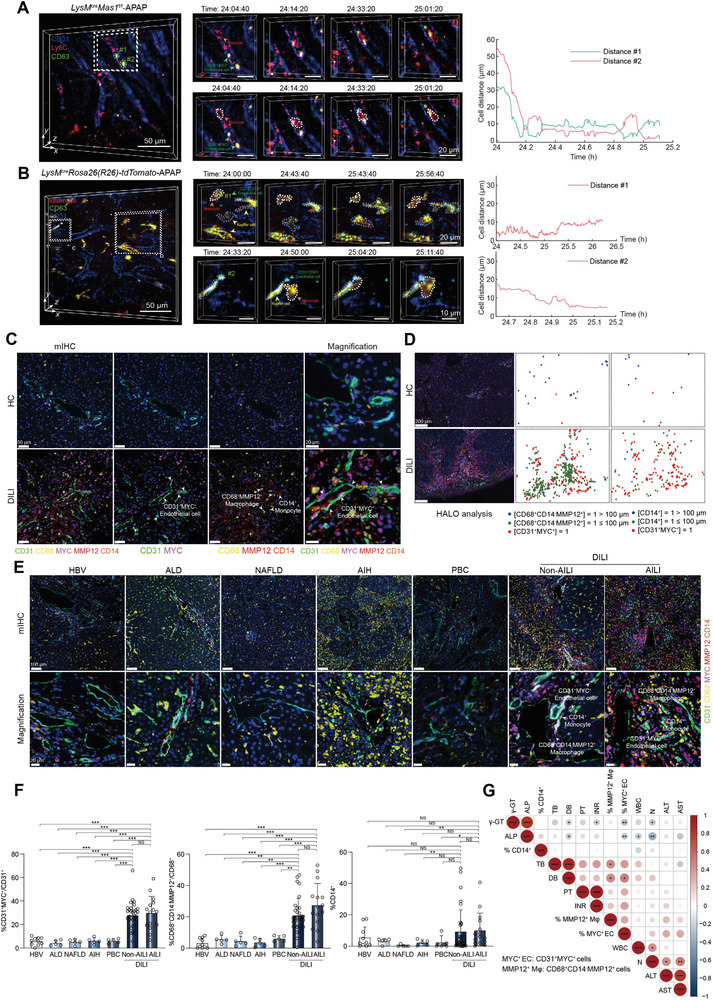
The characteristic AILI microenvironment visualized by DAOSLIMIT in living mice correlates well with human DILI progression. A‐B) Timelapse data captured by DAOSLIMIT showing the interactions between monocytes and CD63+ ECs in LysM cre Mas1 f/f‐APAP mouse (A) and LysM cre Rosa26(R26)‐tdTomato‐APAP mouse (B). The curves of cell distances are shown on the right. Scale bar: 50 µm. C) mIHC of CD31+MYC+ ECs, CD68+CD14−MMP12+ Mψ and CD14+ monocytes in the livers of healthy individuals and patients with DILI (n = 14 healthy and 47 with DILI). Scale bar: 50 µm and 20 µm. D) Spatial localization of CD31+MYC+ ECs, CD68+CD14−MMP12+ Mψ and CD14+ monocytes within injured region (n = 14 healthy and 47 with DILI). Scale bar: 200 µm. E) mIHC of CD31+MYC+ ECs, CD68+CD14−MMP12+ Mψ and CD14+ monocytes in the livers of patients with chronic hepatitis B (CHB), alcoholic liver disease (ALD), nonalcoholic fatty liver disease (NAFLD), autoimmune hepatitis (AIH), primary biliary cholangitis (PBC), Non‐AILI and AILI (n = 10 with CHB, 5 with ALD, 5 with NAFLD, 5 with AIH, 5 with PBC, 32 with Non‐AILI and 15 with AILI). Scale bar: 100 µm and 20 µm. F) Quantification of CD31+MYC+ ECs, CD68+CD14−MMP12+ Mψ and CD14+ monocytes for mIHC as shown in E (n = 10 with CHB, 5 with ALD, 5 with NAFLD, 5 with AIH, 5 with PBC, 32 with Non‐AILI and 15 with AILI; two‐sided Student's t‐test and two‐sided Mann‐Whitney U test; p = 5.00 × 10⁻⁶, 5.30 × 10⁻⁴, 5.30 × 10⁻⁴, 6.24 × 10⁻⁴, 6.24 × 10⁻⁴, 1.00 × 10⁻⁵, 5.00 × 10⁻⁶, 8.00 × 10⁻⁶, 1.20 × 10⁻⁵, 1.30 × 10⁻⁵, 5.84 × 10⁻¹ from left to right for quantification of CD31+MYC+ ECs; p = 9.00 × 10⁻⁶, 1.01 × 10⁻³, 1.01 × 10⁻³, 8.62 × 10⁻⁴, 1.18 × 10⁻³, 8.20 × 10⁻⁵, 2.80 × 10⁻⁵, 1.70 × 10⁻⁵, 1.00 × 10⁻⁵, 3.70 × 10⁻⁵, 9.13 × 10⁻² from left to right for quantification of CD68+CD14−MMP12+ Mψ; p = 6.79 × 10⁻¹, 8.24 × 10⁻¹, 6.72 × 10⁻³, 4.77 × 10⁻¹, 1.10 × 10⁻¹, 2.22 × 10⁻¹, 1.90 × 10⁻¹, 5.20 × 10⁻³, 8.87 × 10⁻², 4.46 × 10⁻², 2.18 × 10⁻¹ from left to right for quantification of CD14+ monocytes). G) Correlation analysis between CD31+MYC+ ECs, CD68+CD14−MMP12+ Mψ, CD14+ monocytes and DILI pathology parameters (n = 47 patients; Pearson correlation; color and circle size indicate correlation). In all graphs data are presented as mean ± SD, *p < 0.05; **p < 0.01; ***p < 0.001; NS, non‐significant.