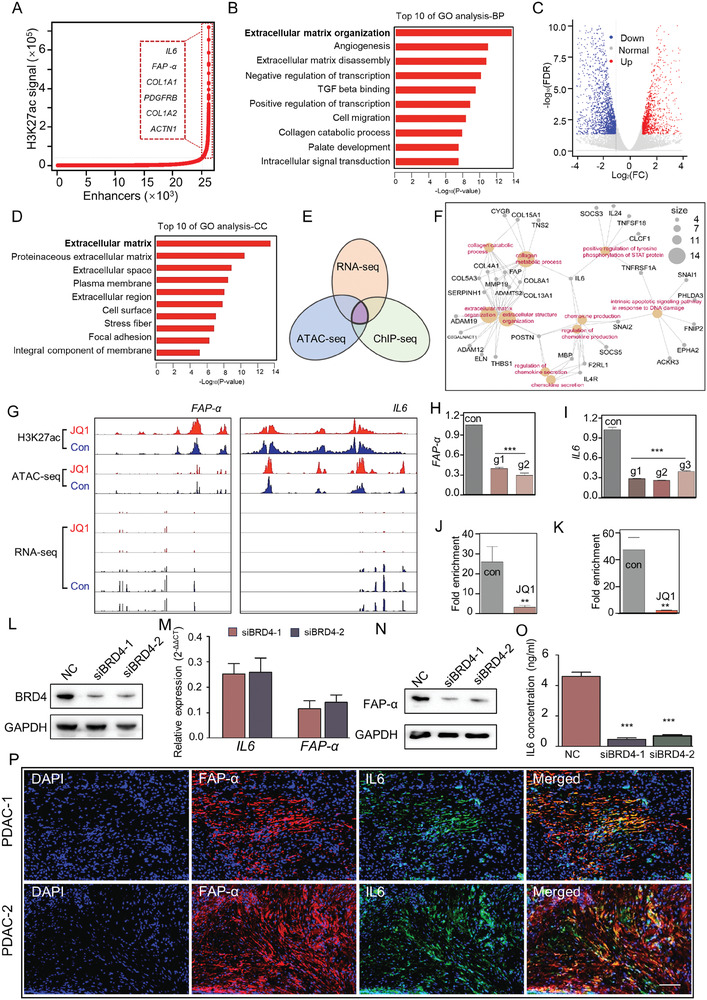
Figure 2.

Super‐enhancers were associated with genes involved in a‐PSCs activation. A) SE regions in a‐PSCs were plotted according to H3K27Ac ChIP‐seq data. Enhancers above the inflection point of the curve (those in the dotted rectangle of the curve) were defined as SEs. Representative SE‐associated genes are shown in a dotted rectangle on the left of the curve. B) The top 10 most significant GO terms in the biological process category enriched by the SE‐associated genes in a‐PSCs. C) A volcano plot displaying the differentially expressed genes (DEGs) between the control (con) and JQ1 groups of a‐PSCs as determined by RNA‐seq. D) The top 10 most significant GO terms in the cellular component category enriched by the down‐regulated DEGs. E) A Venn diagram displaying the overlap between the down‐regulated DEGs and SE‐associated genes in a‐PSCs identified by both H3K27Ac ChIP‐seq and ATAC‐seq techniques. F) The genes that fell into the overlapping part in the Venn diagram of panel E) are summarized into a network. G) H3K27Ac ChIP‐seq, ATAC‐seq, and RNA‐seq profiles for FAP‐α and IL6 are visualized by the IGV software. H,I) Relative mRNA expression levels of FAP‐α and IL6 after knocking out multiple enhancer sites with the CRISPR/Cas9 technique. J,K) Decreased occupancy of BRD4 in the FAP‐α and IL6 SE regions after treatment with JQ1. L) Western blotting analysis for BRD4 protein levels in a‐PSCs after the cells were transfected with siRNAs against BRD4 or the negative control (NC). M) Relative FAP‐α and IL6 mRNA expression levels in a‐PSCs transfected with siRNAs against BRD4 or the NC. N) Western blotting analysis for FAP‐α protein levels in a‐PSCs transfected with siRNAs against BRD4 or the NC. O) Concentrations of IL6 in the cell culture media of a‐PSCs transfected with siRNAs against BRD4 or the NC. P) Immunofluorescence assays for FAP‐α and IL6 in two representative PDAC tissues, n = 6. Scale bar, 100 µm. Data are represented as mean ± standard deviation (SD) of three independent experiments or triplicates, and p values were determined by a two‐tailed unpaired t‐test. ** p < 0.01, *** p < 0.001 compared with the con or NC groups.
