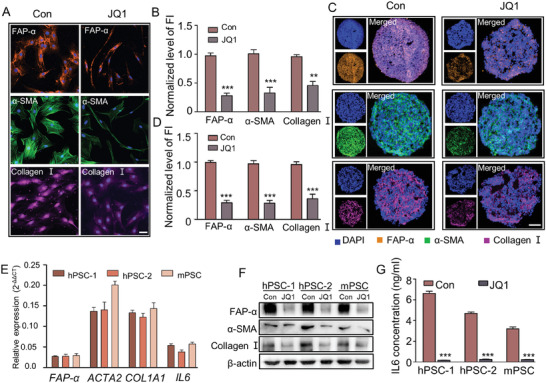
Figure 3.

Disruption of SEs decreased the expression of genes involved in a‐PSC activation at both mRNA and protein levels. A) Immunofluorescence assays for FAP‐α, α‐SMA, and collagen I in PSCs before and after JQ1 treatment. Scale bar, 50 µm. B) Quantitative analysis of normalized fluorescence intensity (FI) levels for FAP‐α, α‐SMA, and collagen I. C) Immunofluorescence assays for FAP‐α, α‐SMA, and collagen I in slices of tumor spheres from 3D cell culture models before and after JQ1 treatment. Scale bar, 100 µm. D) Quantitative analysis of normalized fluorescence intensity (FI) levels for FAP‐α, α‐SMA, and collagen I. E) Relative mRNA expression levels of representative SE‐associated genes in human and mouse PSCs after JQ1 treatment. F) Western blotting analysis for FAP‐α, α‐SMA, and collagen I protein levels in human and mouse PSCs before and after JQ1 treatment. G) Concentrations of IL6 in the cell culture media of human and mouse PSCs before and after JQ1 treatment. Data are represented as mean ± standard deviation (SD) of three independent experiments or triplicates, and p values were determined by a two‐tailed unpaired t‐test. ** p < 0.01, *** p < 0.001 compared with the Con groups.
