Figure 5.

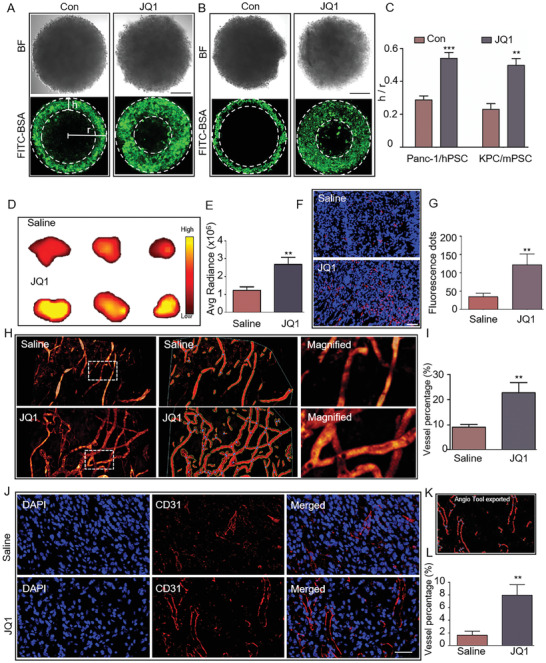
Disruption of SEs by JQ1 treatment enhanced drug penetration and promoted vascularization in PDAC tumors. A,B) Representative images showing the penetration depth of FITC‐BSA into tumor spheres from human and mouse 3D cell culture models before and after JQ1 treatment. BF, bright field. Scale bar, 100 µm. C) Quantitative analysis of the findings shown in panel (A and B). Data are represented as mean ± standard deviation (SD) of three independent experiments or triplicates, and p values were determined by a two‐tailed unpaired t‐test. D) Fluorescence signal intensities of dissected orthotopic tumors from saline‐ or JQ1‐treated mice injected with the fluorescent molecule Cy7. n = 3 for each group. E) Quantitative analysis of the findings shown in panel (D). F) Fluorescence signals (red dots) detected in orthotopic tumor slices from saline‐ or JQ1‐treated mice injected with 400‐nm fluorescent spheres. n = 3 for each group. Scale bar, 50 µm. G) Quantitative analysis of the findings shown in panel (F). H) Multi‐photon fluorescence microscopy images displaying intratumor vessels after i.v. administration of 70‐kDa FITC‐dextran into saline‐ or JQ1‐treated mice. n = 3 for each group. I) Quantitative analysis of tumor vessel densities in orthotopic tumors obtained from saline‐ or JQ1‐treated mice injected with the 70‐kDa FITC‐dextran. J) Representative IF images for CD31 in orthotopic tumors obtained from saline‐ or JQ1‐treated mice. Scale bar, 50 µm. n = 3 for each group. K) A picture exported from AngioTool showing CD31‐positive areas in an orthotopic tumor slice. L) Quantitative analysis of CD31‐positive areas in orthotopic tumors obtained from saline‐ or JQ1‐treated mice. Data are shown as mean ± SD and p values were determined by a two‐tailed unpaired t‐test. ** p < 0.01, *** p < 0.001 compared with the con or Saline groups.
