
Figure 8.
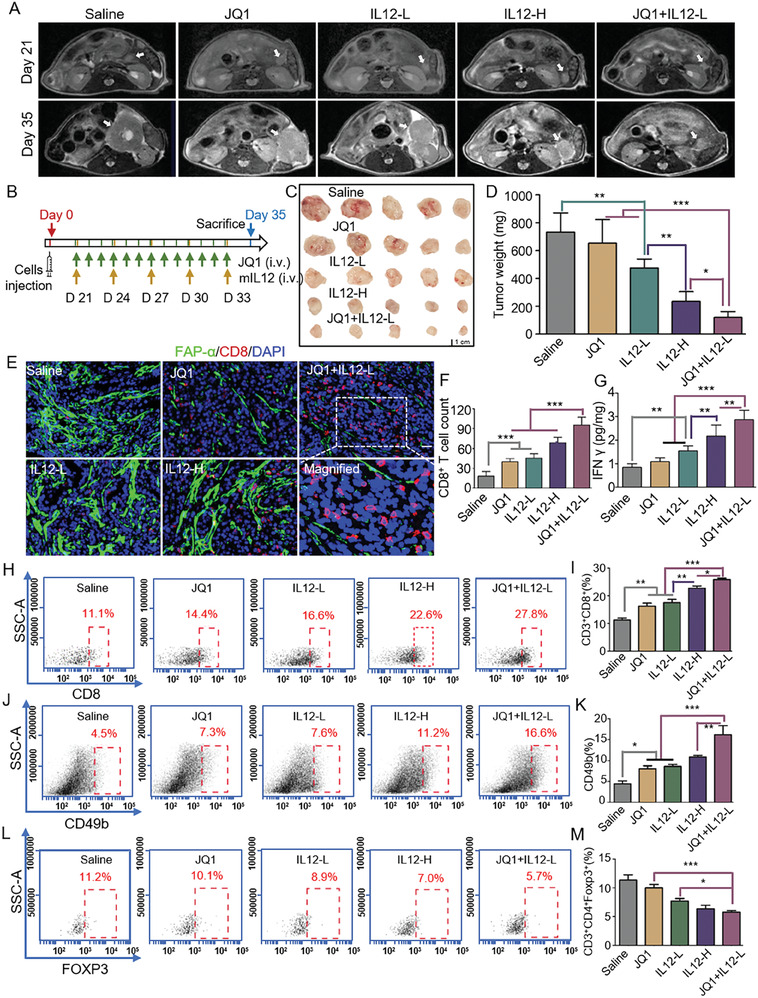
JQ1 treatment enhanced the antitumor efficacy of IL12 immunotherapy against PDAC in vivo. A) Representative MR images for orthotopic tumors of the Saline, JQ1, IL12‐L, IL12‐H, and JQ1+IL12‐L groups of mice captured on Day 21 and Day 35. B) Scheme of JQ1 and different doses of IL12 treatments (or their combinations) in the immunocompetent orthotopic pancreatic cancer mouse model. C) Images for dissected orthotopic tumors from the five groups of mice, n = 5 for each group. D) Weights of the dissected orthotopic tumors. E) Representative IF findings for FAP‐α and CD8 in orthotopic tumor sections from the five groups of mice. Scale bar, 20 µm. FAP‐α, green; CD8, red. F) CD8+ T cell counts in the orthotopic tumor sections. G) IFNγ concentrations in the orthotopic tumor tissues detected by ELISA. H) Representative flow cytometry scatter plots for CD3+CD8+ T cells. I) Quantification of intratumoral CD3+CD8+ T cells for the five treatment groups. J) Representative flow cytometry scatter plots for CD49b+ immune cells. K) Quantification of intratumoral CD49b+ NK cells for the five treatment groups. L) Representative flow cytometry scatter plots for CD3+CD4+Foxp3+ immune cells. M) Quantification of intratumoral CD3+CD4+Foxp3+ Treg cells for the five treatment groups. n = 5 for each group. Data were shown as mean ± SD and p values were determined by one‐way ANOVA analysis. * p < 0.05, ** p < 0.01, *** p < 0.001 compared with the Saline or con groups.