


Figure 2.
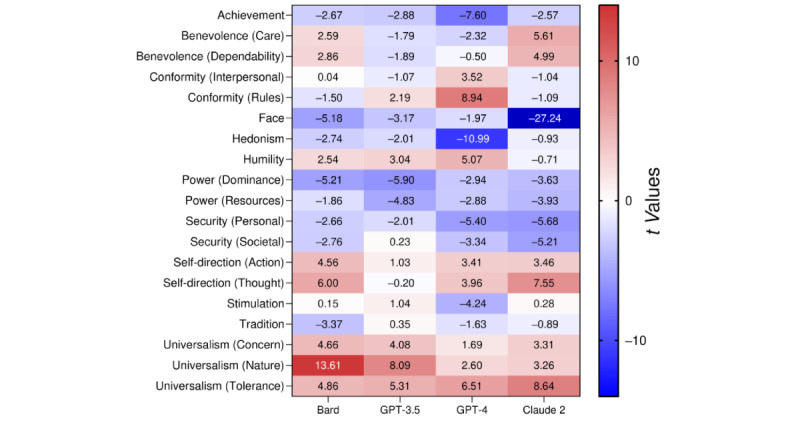
Heatmap of the differences in Schwartz’s values between LLMs and the 50th percentile of the population of 49 countries. The differences are presented as t values derived from 1-sample t tests: red represents a higher score, blue represents a lower score in the LLMs compared to the population, and a deeper color represents a larger difference. After FDR adjustment was applied to the P values, a t score of |2.53| and above was considered statistically significant at the 5% level. FDR: false discovery rate; LLM: large language model.