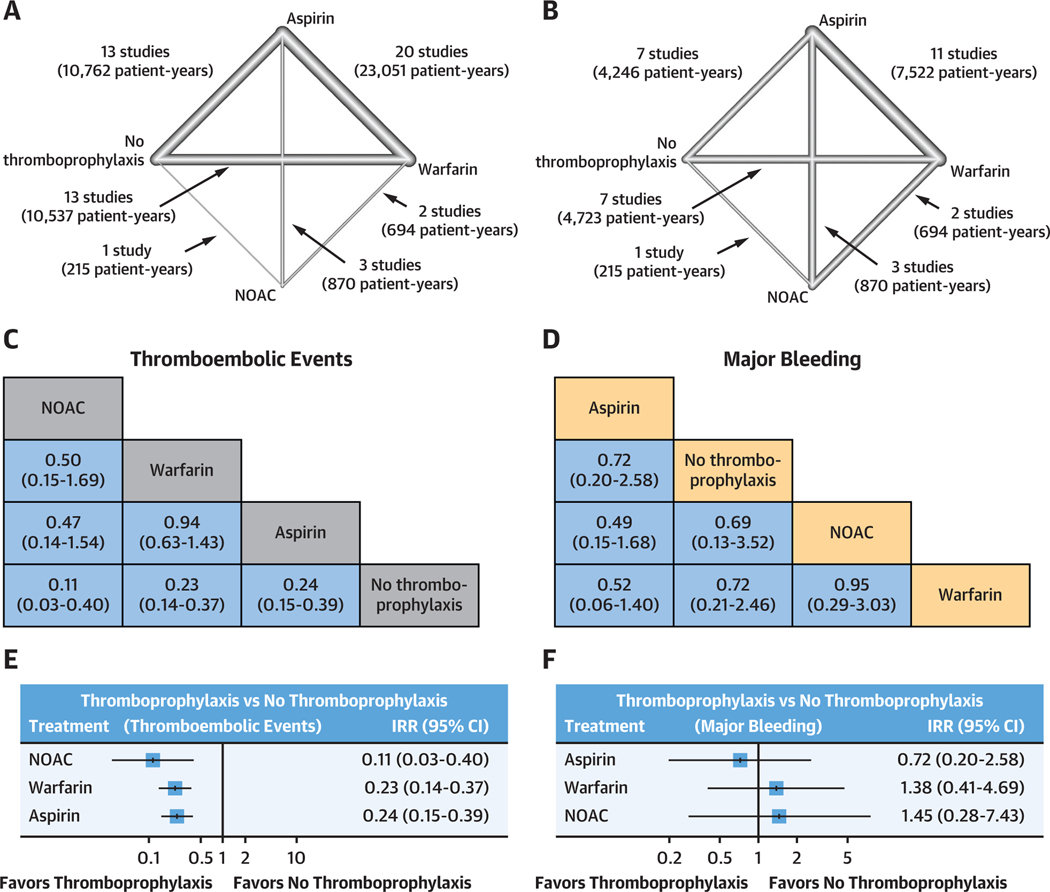
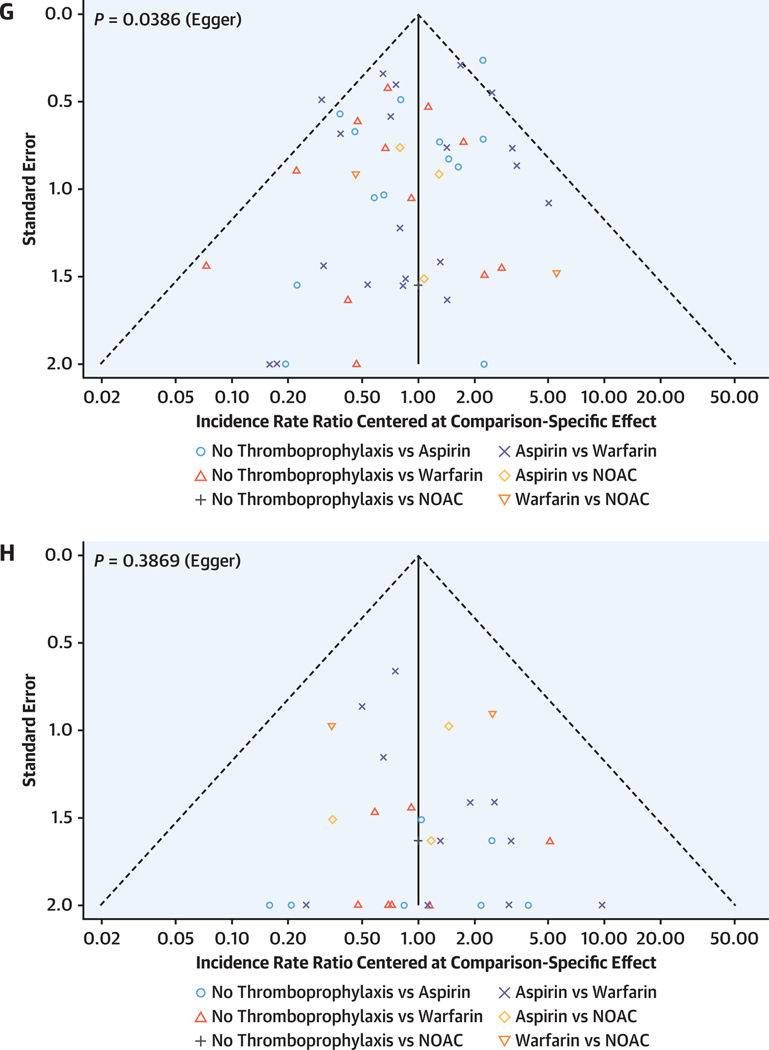
FIGURE 4. Results of the Random-Effects Network Meta-Analysis.
(A and B) Network plots showing the strategies that have been tested for their efficacy in preventing thromboembolic events (A) and safety in terms of major bleeding (B). Lines are weighted according to the number of studies comparing the 2 connected strategies. (C and D) League plots representing the results of the network meta-analyses comparing the effect of all strategies. The estimates (incidence rate ratio [IRR], 95% CI) are presented for each comparison; IRR >1 favors the row-defining treatment, and IRR <1 favors the column-defining treatment. (E and F) Forest plots summarizing the network estimates for each thromboprophylaxis strategy compared with no thromboprophylaxis. (G and H). All strategies have a lower risk for thrombosis compared with no treatment and no increased risk of bleeding. Funnel plots for thromboembolic events (G) and major bleeding (H). The results resemble a symmetrical inverted funnel suggesting low between study heterogeneity. NOAC = nonvitamin K oral anticoagulant.


