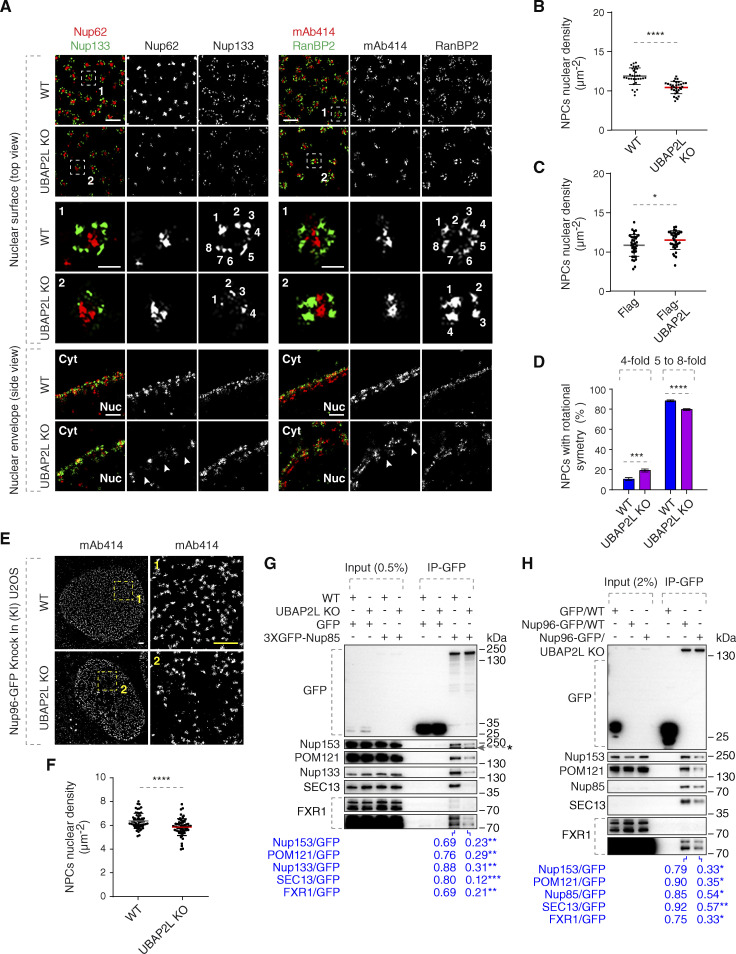
Figure 5.
UBAP2L may facilitate the assembly of the NPC scaffold elements and the biogenesis of NPCs. (A) Representative splitSMLM images depicting several NPC components on the nuclear surface (top view) and in the cross-section of the NE (side view) in WT and UBAP2L KO HeLa cells synchronized in early interphase by DTBR at 12 h. Nup133 signal labels the cytoplasmic and nuclear rings of the NPC, the localization of the central channel is visualized by Nup62 and mAb414 antibodies, and the cytoplasmic filaments are labeled by RanBP2. The magnified framed regions are shown in the corresponding numbered panels. The nuclear (Nuc) and cytoplasmic (Cyt) side of the NE are indicated in the side view. The arrowheads indicate the disrupted localization of Nup62 or mAb414 at NE in UBAP2L KO HeLa cells and the numbers point to the individual identified spokes of the NPC. Scale bars, 300 and 100 nm, respectively. (B and C) The nuclear density of NPCs (mAb414 and RanBP2) in cells shown in A was quantified (B) (mean ± SD, ****P < 0.0001, unpaired two-tailed t test; counted 32 cells per cell line). The nuclear density of NPCs (mAb414) in HeLa cells expressing Flag alone or Flag-UBAP2L for 35 h and synchronized in interphase by DTBR at 12 h was quantified (C) (mean ± SD, *P < 0.05, unpaired two-tailed t test; counted 35 cells for Flag and 32 cells for Flag-UBAP2L). The corresponding representative images are shown in Fig. S2 B. (D) The rotational symmetry of NPCs in A was quantified by alignment of Nup133 particles and segmentation analysis (mean ± SD, ***P < 0.001, ****P < 0.0001, unpaired two-tailed t test; counted 851 NPCs for WT HeLa cell line and 559 NPCs for UBAP2L KO HeLa cell line). (E and F) Representative SMLM immunofluorescence images of FG-Nups (mAb414) at the nuclear surface in Nup96-GFP KI U2OS WT and UBAP2L KO cells in interphase cells synchronized by DTBR at 12 h. Scale bars, 1 μm (E). The nuclear density of NPCs (mAb414) in cells shown in E was quantified in F (mean ± SD, ****P < 0.0001, unpaired two-tailed t test; counted 60 cells per cell line). (G) Lysates of interphase WT and UBAP2L KO HeLa cells expressing GFP alone or 3XGFP-Nup85 for 27 h were immunoprecipitated using agarose GFP-Trap A beads (GFP-IP), analyzed by western blot, and signal intensities were quantified (shown a mean value, **P < 0.01, ***P < 0.001, unpaired two-tailed t test; n = 3 independent experiments). The asterisk indicates a non-specific, faster migrating band. (H) Lysates of interphase U2OS cells expressing GFP alone for 27 h and Nup96-GFP KI U2OS WT and UBAP2L KO cells were immunoprecipitated using agarose GFP-Trap A beads (GFP-IP), analyzed by western blot, and signal intensities were quantified (shown a mean value, *P < 0.05, **P < 0.01, unpaired two-tailed t test; n = 3 independent experiments) (H). Source data are available for this figure: SourceData F5.

