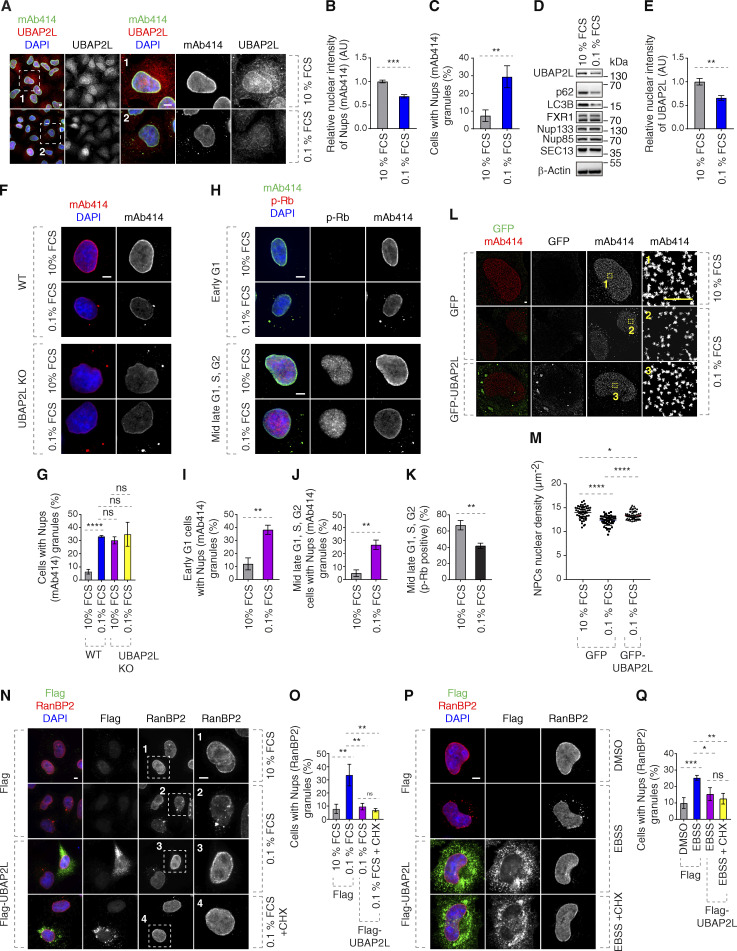
Figure 9.
UBAP2L-dependent regulation of Nups facilitates adaptation to nutrient stress. (A–E) Representative immunofluorescence images depicting the localization of UBAP2L and Nups (mAb414) in HeLa cells cultured in the indicated concentrations of serum for 72 h. Nuclei were stained with DAPI. Scale bars, 5 μm (A). The protein levels of UBAP2L, Nups, FXR1, and other indicated factors shown in A were analyzed by western blot (D). The nuclear intensity of Nups (mAb414) (B) and the percentage of cells with the cytoplasmic granules of Nups (mAb414) (C) and the nuclear intensity of UBAP2L (E) shown in A were quantified. At least 100 cells per condition were analyzed (mean ± SD, **P < 0.01, ***P < 0.001, unpaired two-tailed t test, n = 3 independent experiments). (F and G) Representative immunofluorescence images depicting the localization of Nups (mAb414) in WT and UBAP2L KO HeLa cells cultured in the indicated concentrations of serum for 72 h. Nuclei were stained with DAPI. Scale bar, 5 μm (F). The percentage of cells with the cytoplasmic granules of Nups (mAb414) (G) shown in F was quantified. At least 100 cells per condition were analyzed (mean ± SD, ns: not significant, ****P < 0.0001, unpaired two-tailed t test, n = 3 independent experiments). (H–K) Representative immunofluorescence images depicting the localization of p-Rb and Nups (mAb414) in HeLa cells cultured in the indicated concentrations of serum for 72 h. Nuclei were stained with DAPI. Scale bars, 5 μm (H). The percentage of cells with the cytoplasmic granules of Nups (mAb414) in early G1 (I) and mid-late G1, S, G2 (J), and the percentage of p-Rb–positive cells (K) shown in H were quantified. At least 100 cells per condition were analyzed (mean ± SD, **P < 0.01, unpaired two-tailed t test, n = 3 independent experiments). (L and M) Representative SMLM immunofluorescence images of FG-Nups (mAb414) at the nuclear surface in interphase HeLa cells expressing GFP alone or GFP-UBAP2L WT for 48 h cultured in the indicated concentrations of serum for 72 h. The magnified framed regions are shown in the corresponding numbered panels. Scale bar, 1 μm (L). The nuclear density of NPCs (mAb414) in cells shown in L was quantified (M) (mean ± SD, *P < 0.05, ****P < 0.0001, unpaired two-tailed t test; counted 51 cells per cell line). (N and O) Representative immunofluorescence images depicting the localization of RanBP2 in HeLa cells expressing Flag alone or Flag-UBAP2L for 30 h cultured in the indicated concentrations of serum for 72 h. Note that CHX was used at a concentration of 0.1 mg/ml for 8 h prior to sample collection. The magnified framed regions are shown in the corresponding numbered panels. Nuclei were stained with DAPI. Scale bar, 5 μm (N). The percentage of cells with the cytoplasmic granules containing RanBP2 shown in N was quantified (O). At least 100 cells per condition were analyzed (mean ± SD, ns: not significant, **P < 0.01, unpaired two-tailed t test, n = 3 independent experiments). (P and Q) Representative immunofluorescence images depicting the localization of RanBP2 in HeLa cells expressing Flag alone or Flag-UBAP2L for 28 h and then cultured in the Earle’s Balanced Salt Solution (EBSS) medium for 4 h. Note that CHX was used at a concentration of 0.1 mg/ml for 4 h prior to sample collection. Nuclei were stained with DAPI. Scale bar, 5 μm (P). The percentage of cells with the cytoplasmic granules containing RanBP2 shown in P was quantified (Q). At least 100 cells per condition were analyzed (mean ± SD, ns: not significant, *P < 0.05, **P < 0.01, ***P < 0.001, unpaired two-tailed t test, n = 3 independent experiments). Source data are available for this figure: SourceData F9.

