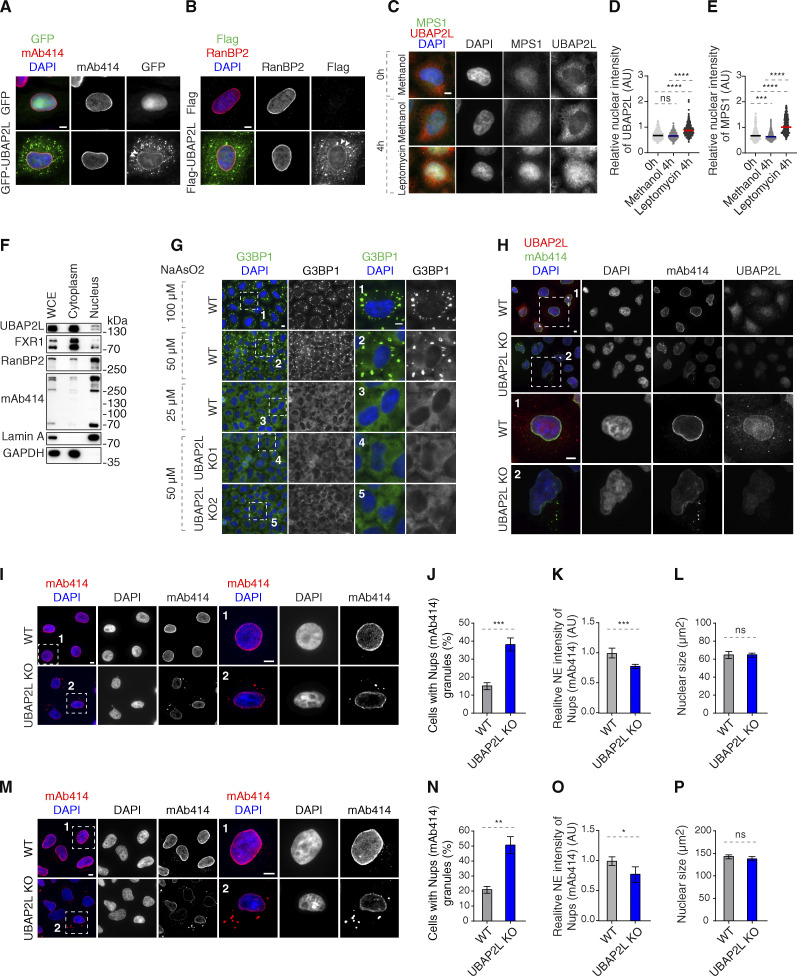
Figure S1.
UBAP2L shuttles between cytoplasm and nucleus. (A) Representative immunofluorescence images depicting the localization of UBAP2L and Nups (mAb414) in HeLa cells expressing GFP alone or GFP-UBAP2L. The arrowheads indicate the NE localization of GFP-tagged UBAP2L. Scale bar, 5 μm. (B) Representative immunofluorescence images depicting the localization of UBAP2L and Nups (RanBP2) in HeLa cells expressing Flag alone or Flag-UBAP2L. The arrowheads indicate the NE localization of Flag-tagged UBAP2L. Scale bar, 5 μm. (C–E) Representative immunofluorescence images depicting the cytoplasmic and nuclear localization of UBAP2L and MPS1 (also known as protein kinase TTK) after treatment with the Leptomycin B (inhibitor of nuclear export factor Exportin 1) (100 ng/ml) for 4 h. Nuclei were stained with DAPI. Scale bar, 5 μm (C). The relative nuclear intensity (AU) of UBAP2L (D) and MPS1 (E) shown in C was quantified. At least 150 cells per condition were analyzed (mean ± SD, ns: not significant, ***P < 0.001, ****P < 0.0001, unpaired two-tailed t test, n = 3 independent experiments). (F) Protein levels of UBAP2L, FXR1, and Nups were analyzed by western blot in the whole cell extract (WCE) and in nuclear and cytoplasmic fractions of HeLa cells. (G) Representative immunofluorescence images of WT and UBAP2L KO HeLa cells depicting formation of SGs labeled by G3BP1 at indicated arsenite concentrations. The magnified framed regions are shown in the corresponding numbered panels. Nuclei were stained with DAPI. Scale bars, 5 μm. (H) Representative immunofluorescence images depicting the localization of Nups and UBAP2L in asynchronously proliferating WT and UBAP2L KO HeLa cells visualized by mAb414 and UBAP2L antibodies. Nuclei were stained with DAPI. The magnified framed regions are shown in the corresponding numbered panels. Note that UBAP2L signal is absent in UBAP2L-deleted cells. Scale bars, 5 μm. (I–L) Representative immunofluorescence images depicting the localization and NE intensity of Nups (mAb414) and nuclear size in WT and UBAP2L KO HeLa cells synchronized in G1 phase by lovastatin (10 µM) for 16 h. Nuclei were stained with DAPI. The magnified framed regions are shown in the corresponding numbered panels. Scale bars, 5 μm (I). The cells with Nups (mAb414) granules (J), the NE intensity of Nups (mAb414) (K), and the nuclear size (L) shown in I were quantified. At least 150 cells per condition were analyzed (mean ± SD, ns: not significant, ***P < 0.001, unpaired two-tailed t test, n = 4 independent experiments). (M–P) Representative immunofluorescence images depicting the localization and NE intensity of Nups (mAb414) and nuclear size in WT and UBAP2L KO HeLa cells synchronized in G0/G1 phase by Psoralidin (5 µM) for 24 h. Nuclei were stained with DAPI. The magnified framed regions are shown in the corresponding numbered panels. Scale bars, 5 μm (M). The cells with Nups (mAb414) granules (N), the NE intensity of Nups (mAb414) (O), and the nuclear size (P) shown in M were quantified. At least 200 cells per condition were analyzed (mean ± SD, ns: not significant, *P < 0.05, **P < 0.01, unpaired two-tailed t test, n = 3 independent experiments). Source data are available for this figure: SourceData FS1.

