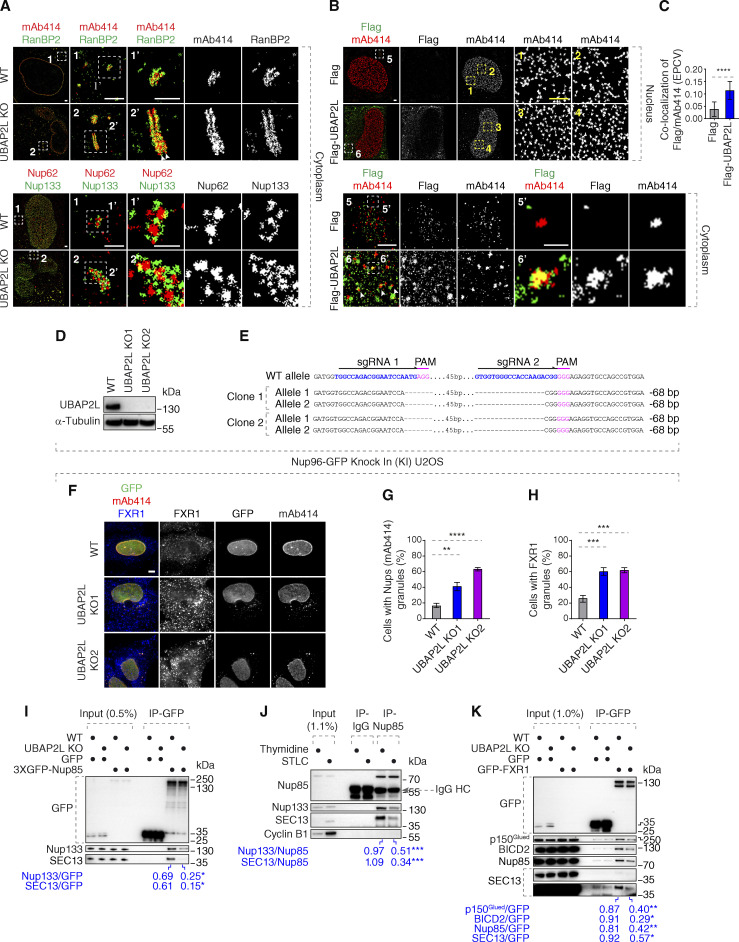
Figure S2.
UBAP2L may inhibit formation of cytoplasmic AL or AL-like Nup assemblies. (A) Representative splitSMLM immunofluorescence images depicting the localization of NPC components corresponding to the central channel (Nups labeled by mAb414) and cytoplasmic filaments (RanBP2) at the NE and in the cytoplasm, as well as the localization of NPC components corresponding to the central channel (FG-Nup Nup62) and the outer ring (Y-complex Nup133) in the cytoplasm in WT and UBAP2L KO HeLa cells synchronized in interphase by DTBR at 12 h. Note that unlike at the NE where RanBP2 can localize exclusively to the cytoplasmic side of the NPCs (Fig. 5 A), deletion of UBAP2L leads to the accumulation of the Nup assemblies in the cytoplasm with a symmetric distribution of RanBP2. Moreover, similar to the nuclear surface, in the cytoplasm, Nup62 signal is surrounded by Nup133 ring-like structures in both WT and UBAP2L KO cells. The magnified framed regions are shown in the corresponding numbered panels. Scale bars, 1,000, 300, and 150 nm, respectively. (B and C) Representative SMLM immunofluorescence images of FG-Nups (mAb414) at the nuclear surface and in the cytoplasm in interphase HeLa cells expressing Flag alone or Flag-UBAP2L for 35 h and synchronized by DTBR at 12 h. The magnified framed regions are shown in the corresponding numbered panels and corresponding quantification is shown in Fig. 5 C. The arrowheads indicate the cytoplasmic co-localization of FLAG-UBAP2L and mAb414-reactive Nups, which were highlighted in the corresponding magnified regions. Scale bars, 1,000 and 500 nm, respectively (B). The colocalization (EPCV, events per cell cytoplasmic view) of cytoplasmic mAb414 with Flag and Flag-UBAP2L in B was measured by CellProfiler (mean ± SD, ****P < 0.0001, unpaired two-tailed t test; counted 35 cells for Flag and 32 cells for Flag-UBAP2L) (C). (D and E) Validation of CRISPR/Cas9-mediated UBAP2L KO Nup96-GFP KI U2OS cell clones by western blot (D) and Sanger sequencing (E). (F–H) Representative immunofluorescence images of the localization of Nups (GFP-Nup96 and mAb414) and FXR1 in WT and in two UBAP2L KO Nup96-GFP KI U2OS clonal cell lines in interphase cells synchronized by DTBR at 15 h. Nuclei were stained with DAPI. Scale bar, 5 μm (F). The percentage of cells with cytoplasmic granules of Nups (mAb414) (G) and of FXR1 (H) shown in F were quantified. At least 200 cells per condition were analyzed (mean ± SD, **P < 0.01, ***P < 0.001, ****P < 0.0001, unpaired two-tailed t test, n = 3 independent experiments). (I) Lysates of WT and UBAP2L KO Hela cells expressing GFP alone or 3XGFP-Nup85 for 27 h and synchronized in G1/S phase by Thymidine 16 h were immunoprecipitated using agarose GFP-Trap A beads (GFP-IP), analyzed by western blot, and signal intensities were quantified (shown a mean value, *P < 0.05, unpaired two-tailed t test; n = 3 independent experiments). (J) HeLa cells lysates of cells synchronized in interphase (Thymidine 16 h) and of cells synchronized in mitosis (STLC 16 h) were immunoprecipitated using Nup85 antibody or IgG, analyzed by western blot, and signal intensities were quantified (shown a mean value, ***P < 0.001, unpaired two-tailed t test; n = 3 independent experiments). (K) Lysates of interphase WT and UBAP2L KO HeLa cells expressing GFP alone or GFP-FXR1 for 27 h were immunoprecipitated using agarose GFP-Trap A beads (GFP-IP), analyzed by western blot, and signal intensities were quantified (shown a mean value, *P < 0.05, **P < 0.01, unpaired two-tailed t test; n = 3 independent experiments). Source data are available for this figure: SourceData FS2.

