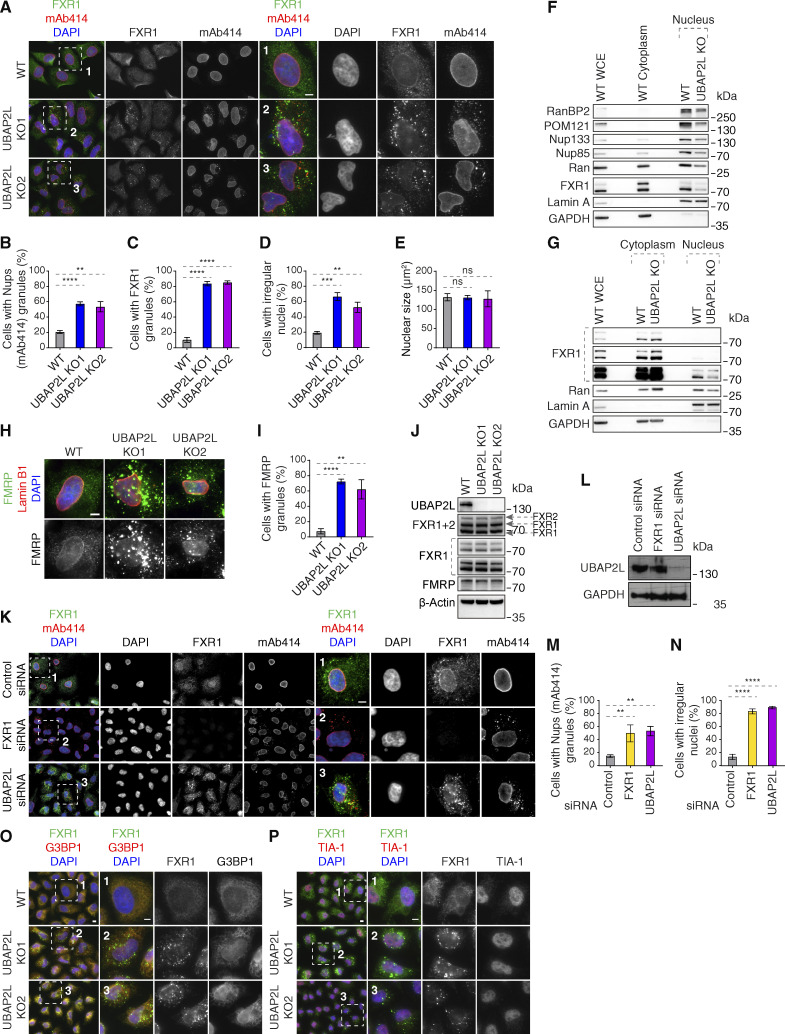
Figure S3.
UBAP2L regulates FXRP proteins in the cytoplasm. (A–E) Representative immunofluorescence images depicting the nuclear shape and localization of Nups (mAb414) and FXR1 in WT and UBAP2L KO HeLa cells in interphase cells synchronized by DTBR at 12 h. The magnified framed regions are shown in the corresponding numbered panels. Nuclei were stained with DAPI. Scale bars, 5 μm (A). The percentage of cells with cytoplasmic granules of Nups (mAb414) (B) and of FXR1 (C) and with irregular nuclei (D) and the nuclear size (E) shown in A were quantified. At least 250 cells per condition were analyzed (mean ± SD, ns: non-significant, **P < 0.01, ***P < 0.001, ****P < 0.0001, unpaired two-tailed t test, n = 3 independent experiments). (F) The nuclear and cytoplasmic protein levels of Nups and NPC transport-associated factors in WT and UBAP2L KO HeLa cells synchronized as in A were analyzed by western blot. WCE indicates whole cell extract. (G) The nuclear and cytoplasmic protein levels of Nups and NPC transport-associated factors in asynchronously proliferating WT and UBAP2L KO HeLa cells were analyzed by western blot. WCE indicates whole cell extract. (H and I) Representative immunofluorescence images depicting the localization of FMRP and Lamin B1 in WT and UBAP2L KO HeLa cells synchronized in interphase by DTBR at 12 h. Nuclei were stained with DAPI. Scale bar, 5 μm (H). The percentage of cells with the cytoplasmic granules containing FMRP shown in H was quantified (I). At least 200 cells per condition were analyzed (mean ± SD, **P < 0.01, ****P < 0.0001, unpaired two-tailed t test, n = 3 independent experiments). (J) The protein levels of FXRP proteins in WT and UBAP2L KO HeLa cells synchronized in interphase by DTBR at 12 h were analyzed by western blot. (K–N) Representative immunofluorescence images depicting localization of FXR1 and Nups (mAb414) and the nuclear shape in the HeLa cells treated with indicated siRNAs and synchronized in interphase by DTBR at 12 h. The magnified framed regions are shown in the corresponding numbered panels. Nuclei were stained with DAPI. Scale bars, 5 μm (K). UBAP2L protein levels in K were analyzed by western blot (L). The percentage of cells with the cytoplasmic granules of Nups (mAb414) (M) and irregular nuclei (N) shown in K were quantified. At least 200 cells per condition were analyzed (mean ± SD, **P < 0.01, ****P < 0.0001, unpaired two-tailed t test, n = 3 independent experiments). (O and P) Representative immunofluorescence images of WT and UBAP2L KO HeLa cells synchronized in interphase by DTBR at 12 h under non-stress conditions depicting localization of FXR1 (O and P), G3BP1 (O), and TIA-1 (P). The magnified framed regions are shown in the corresponding numbered panels. Nuclei were stained with DAPI. Scale bars, 5 μm. Note that FXR1-containing granules present in non-stressed UBAP2L KO HeLa cells do not colocalize with SG components. Source data are available for this figure: SourceData FS3.

